- As discussed in the previous report, EUR/USD found intraday support exactly at 1.1672 in the European session. Which was the scenario in case EUR/USD was not able to support prices at the 1.1700 figure.
- Bulls have currently the upper hand, however the lines-in-the-sand are likely going to be the 1.1700 figure and the 1.1750 which has been resistance since July 17.
- To the downside supports a bear breakout of 1.1672 might lead to 1.1649 July 12 low.
EUR/USD 15-minute chart
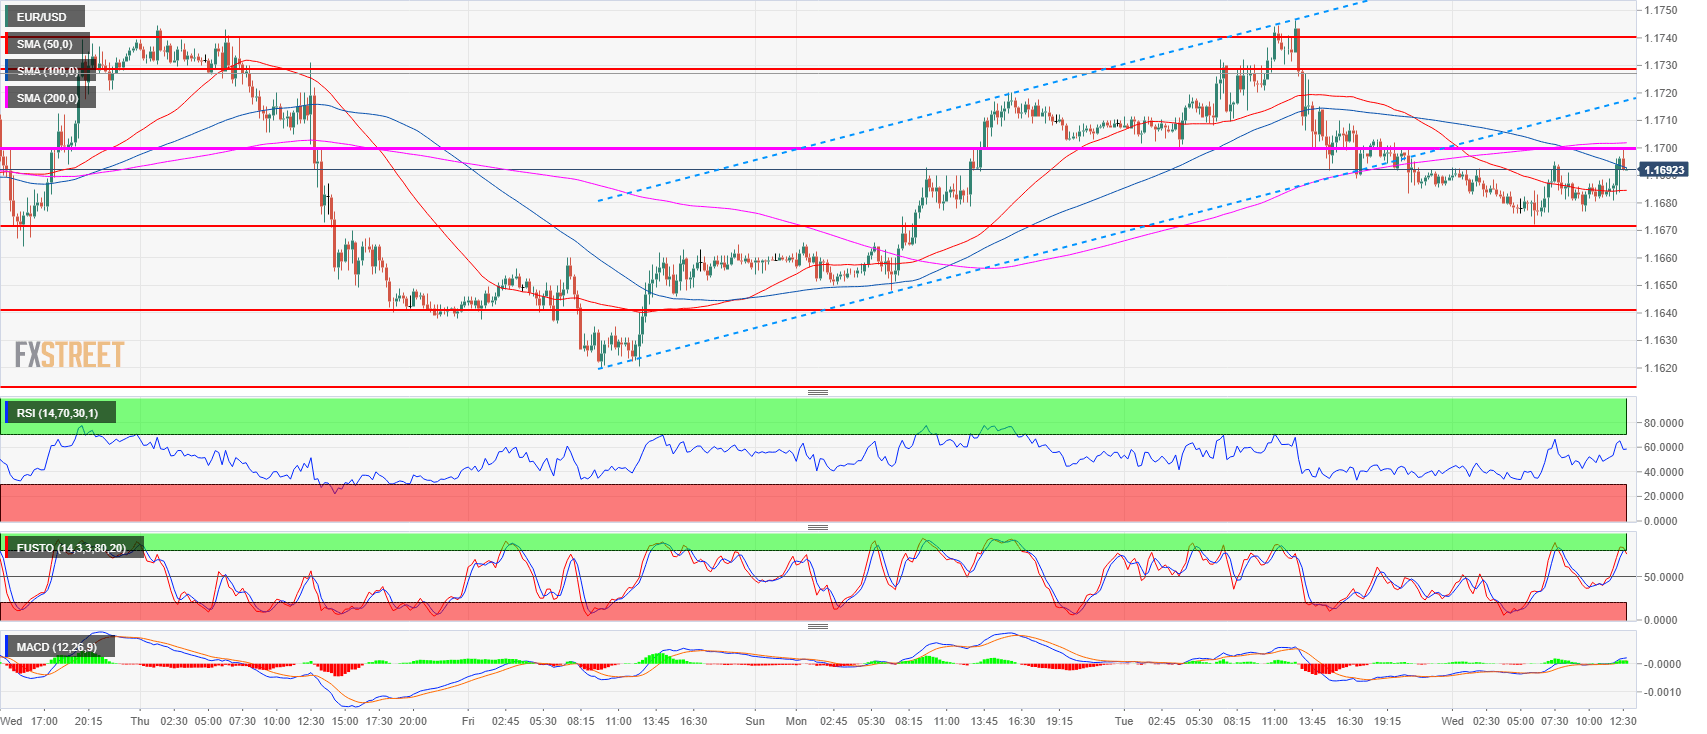
Spot rate: 1.1692
Relative change: 0.01%
High: 1.1700
Low: 1.1672
Trend: Neutral / Bullish above 1.1672
Resistance 1: 1.1700 figure
Resistance 2: 1.1730-1.1740-1.1750 area, 23.6% Fibonacci retracement mid-April-May bear move, figure.
Resistance 3: 1.1760-1.1795 supply levels
Resistance 4: 1.1851-1.1854 area, June high and 38.2% Fibonacci retracement from mid-April-May bear move
Support 1: 1.1672 June 27 high
Support 2: 1.1649 July 12 low
Support 3: 1.1640-1.1649 key level and July 12 low
Support 4: 1.1600-1.1613 figure and July 13 low
Support 5: 1.1560 June 14 low
Support 6: 1.1508 current 2018 low
