- EUR/USD is trying to find support at the 1.1700 level, the 200-period simple moving average and the bullish trendline. In the short-term bulls have a fair chance to support the market but they would need to lift EUR/USD above 1.1710 to get out of the woods.
- On the flip side, bears manage to erase all the daily gains, suggesting building bearish momentum. The 1.1672 level seems to be a more robust support as it was used many times last weeks.
EUR/USD 15-minute chart
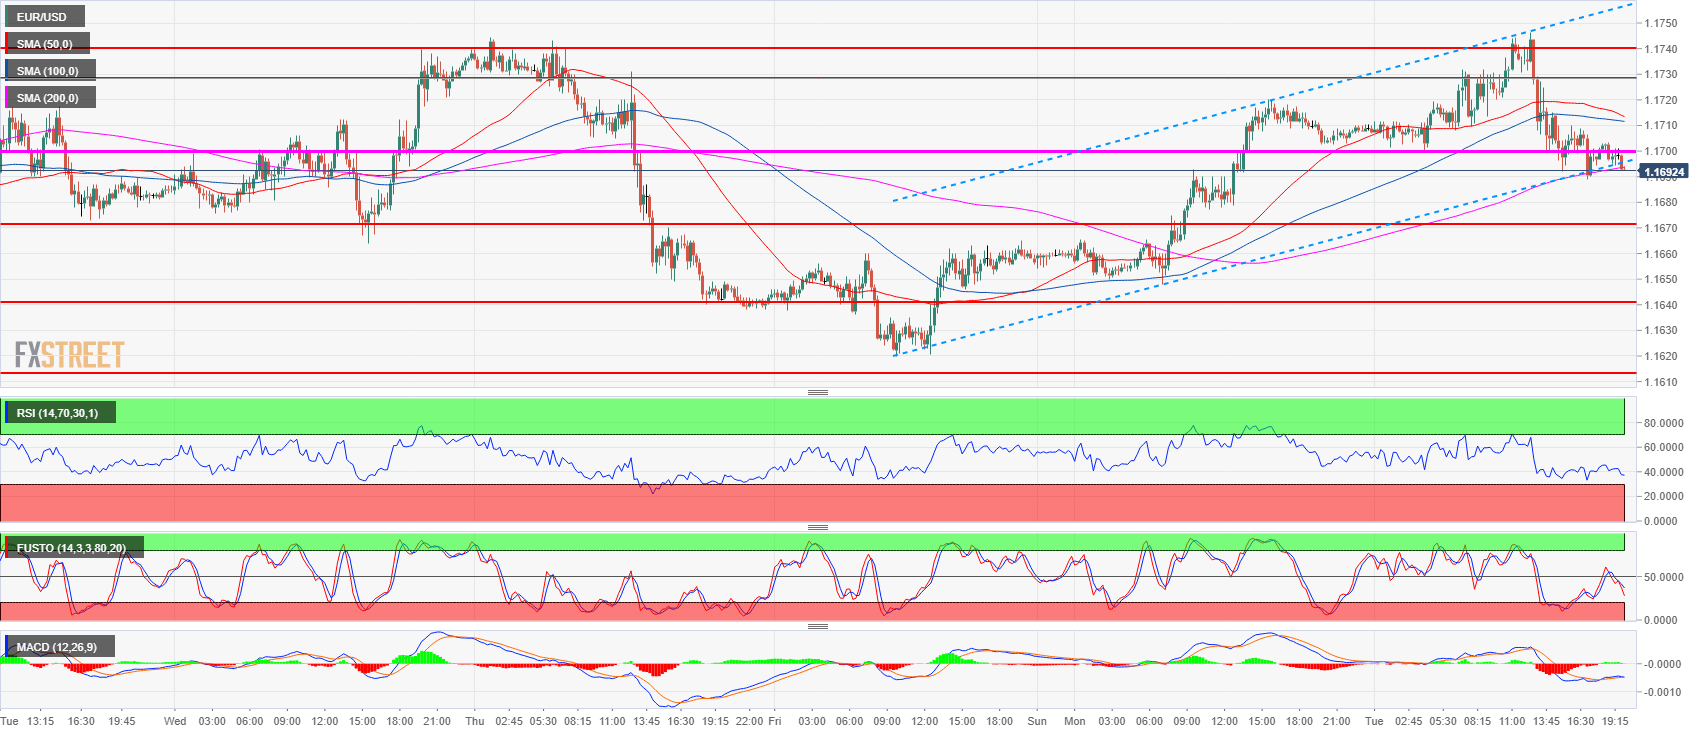
Spot rate: 1.1692
Relative change: -0.12%
High: 1.1746
Low: 1.1689
Trend: Bearish
Resistance 1: 1.1730-1.1740-1.1750 area, 23.6% Fibonacci retracement mid-April-May bear move, figure.
Resistance 2: 1.1760-1.1795 supply levels
Resistance 3: 1.1851-1.1854 area, June high and 38.2% Fibonacci retracement from mid-April-May bear move
Support 1: 1.1700 figure
Support 2: 1.1672 June 27 high
Support 3: 1.1649 July 12 low
Support 4: 1.1640-1.1649 key level and July 12 low
Support 5: 1.1600-1.1613 figure and July 13 low
Support 6: 1.1560 June 14 low
Support 7: 1.1508 current 2018 low
