- EUR/USD is heading towards the 1.0940 resistance on US Dollar weakness.
- The ISM Manufacturing PMI data came in at its lowest since 2009. It fell to 47.8 points in September.
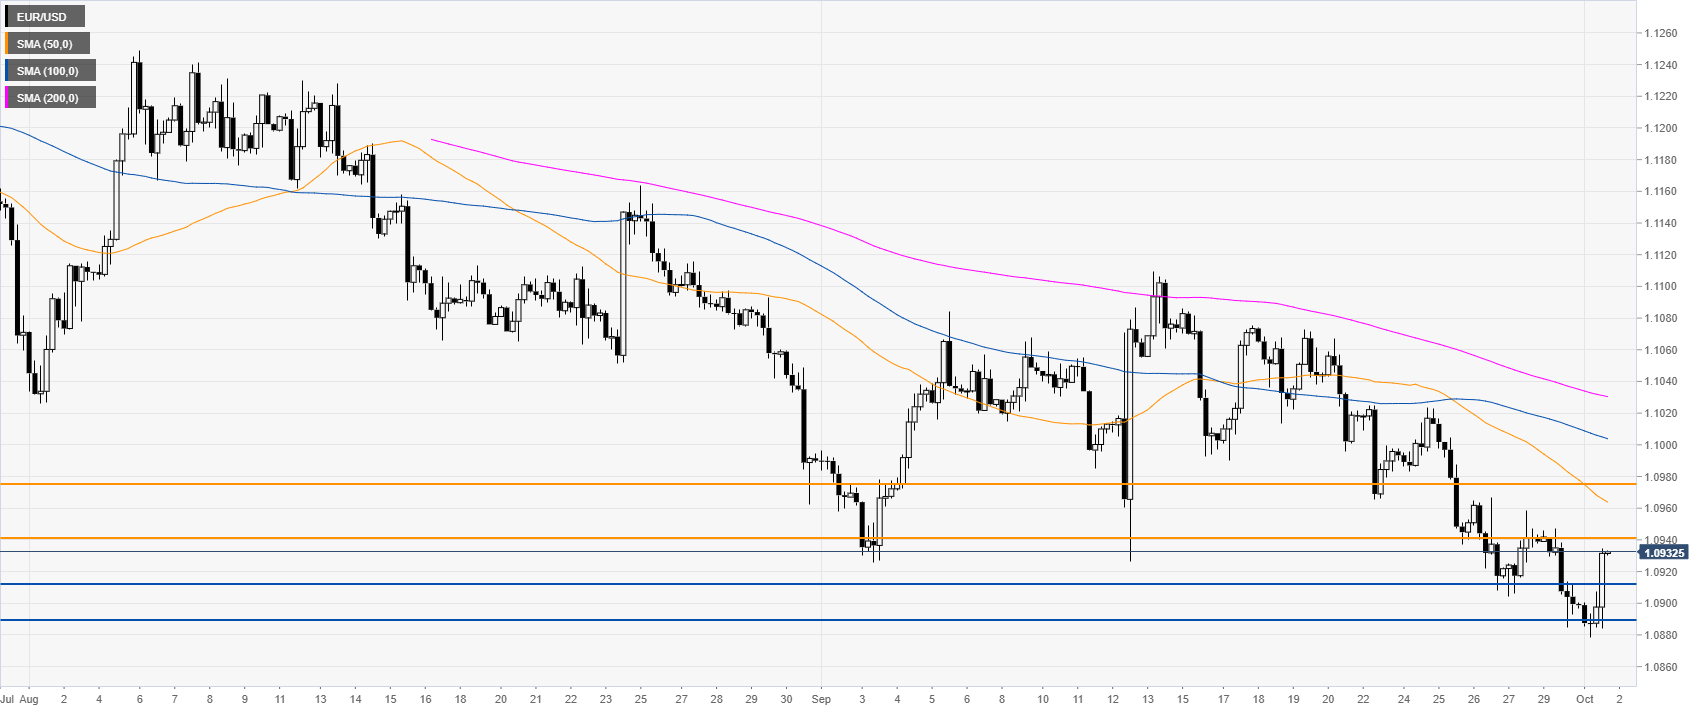
EUR/USD daily chart
The common currency, on the daily time frame, is trading in a bear trend below the main daily simple moving averages (DSMAs). In the European session, the Eurozone inflation came in mixed, having virtually no effect on the EUR/USD. In the New York session, the ISM Manufacturing PMI came in below expectations at 47.8 vs. 50.1 forecast, which is the worst reading since 2009.

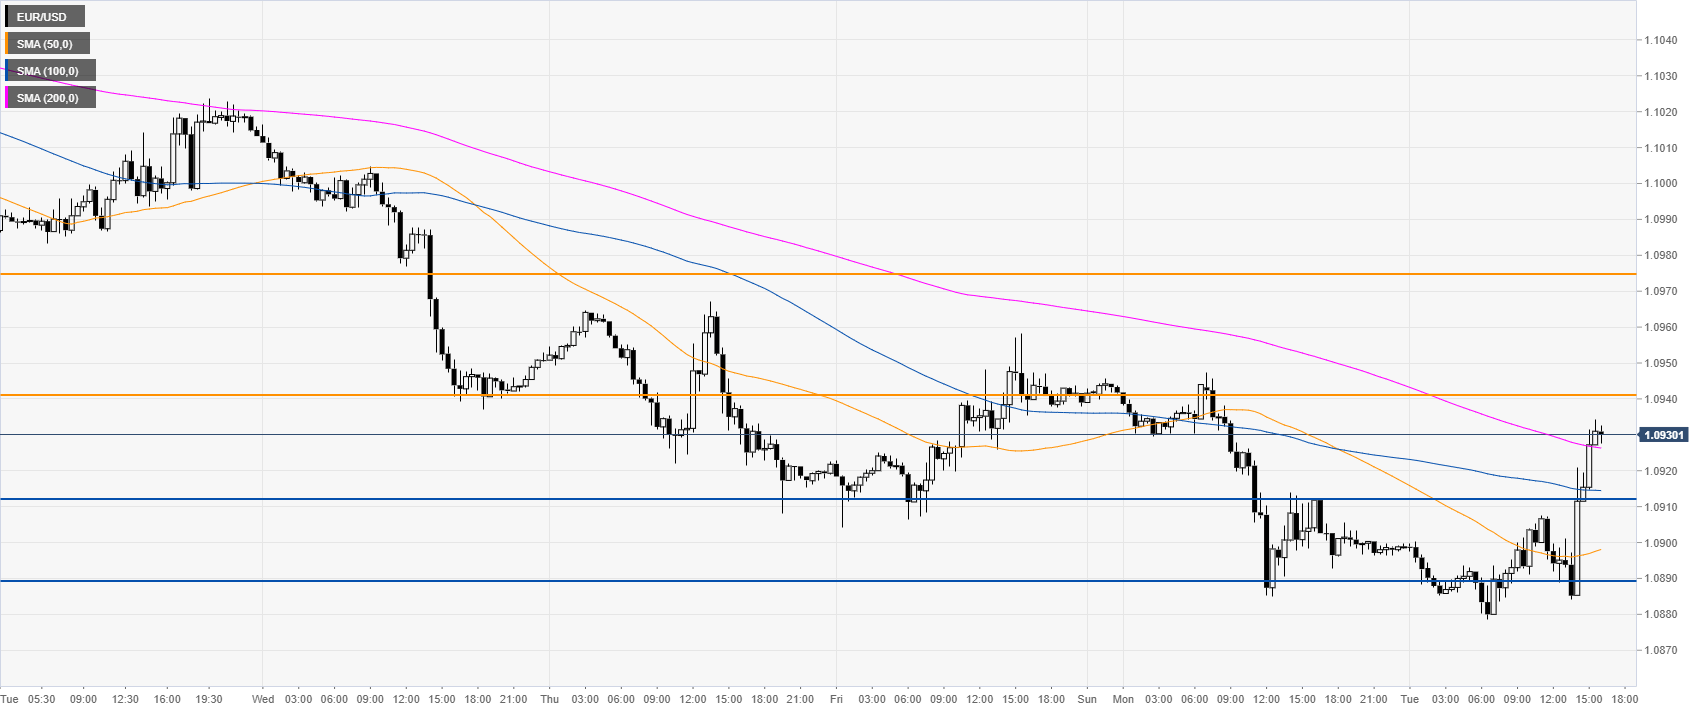
EUR/USD four-hour chart
EUR/USD is trading below the main SMAs, suggesting a bearish bias in the medium term. The market is regaining some ground, although still technically in a bear trend. However, a break above the 1.0940/75 resistance would confirm a reversal up.
EUR/USD 30-minute chart
EUR/USD is trading above the main SMAs, suggesting increasing bullish momentum in the near term. The market broke above the 1.0912 resistance and is en route towards the 1.0940 level. A break above this level can lead to the 1.0975 price level, according to the Technical Confluences Indicator.
Additional key levels
