- EUR/USD bulls are still hanging above the 1.1700 figure as the market has been ranging for the last 10 hours.
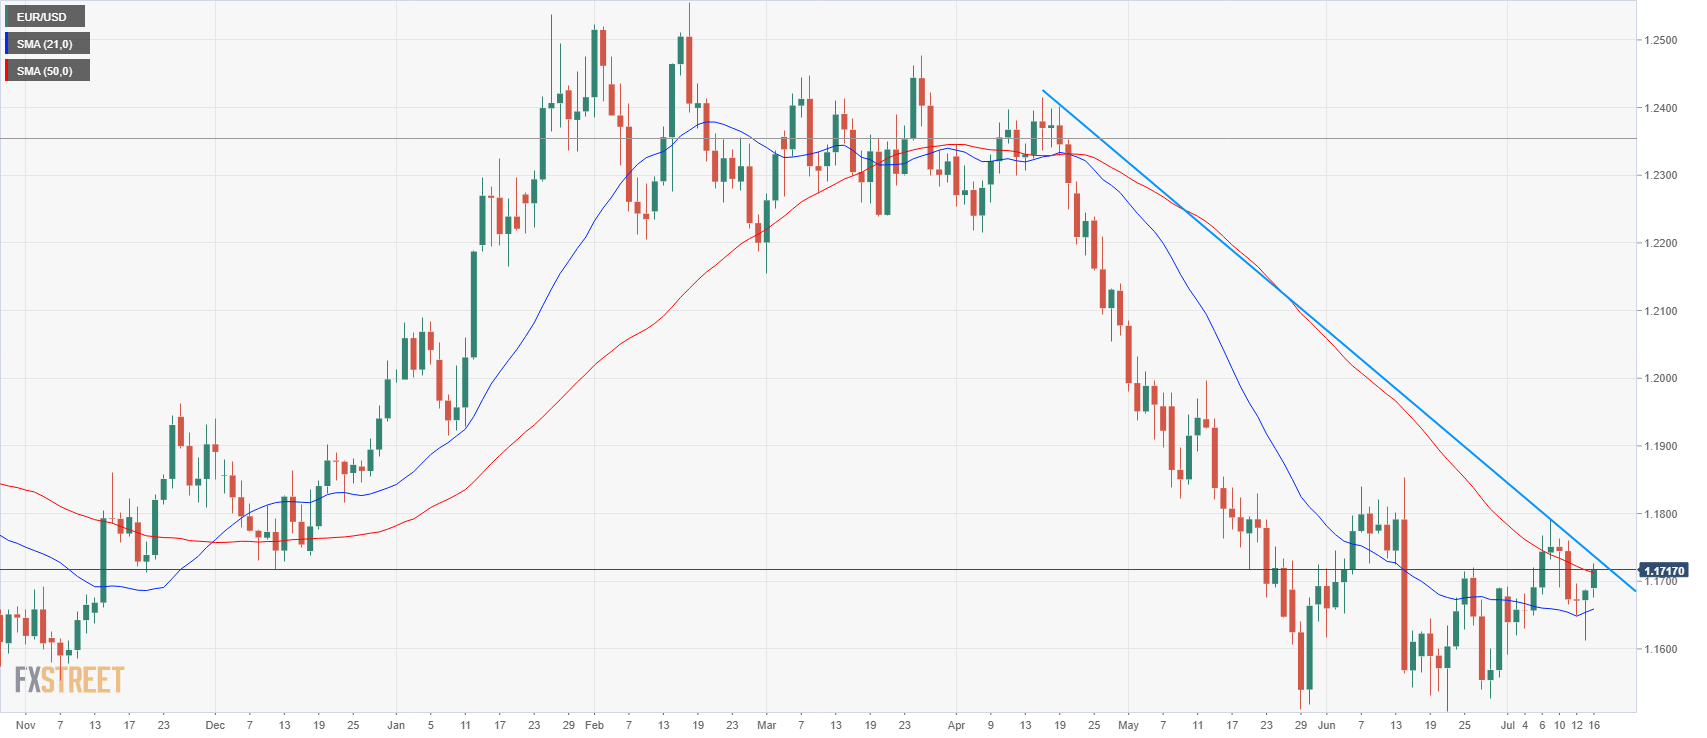
- EUR/USD is currently capped by a daily trendline and the daily 50-period simple moving average. The line in the sand seems to be the 1.1730-1.1740 area. A breakout above the level can lead to an acceleration to 1.1790 and potentially open to gates to 1.1851-1.1854 area.
- However, if the market remains contained below 1.1730-1.1740 area, the potential bull trap can lead to a rotation lower to 1.1672 and 1.1640-1.1649 area.
EUR/USD 15-minute chart
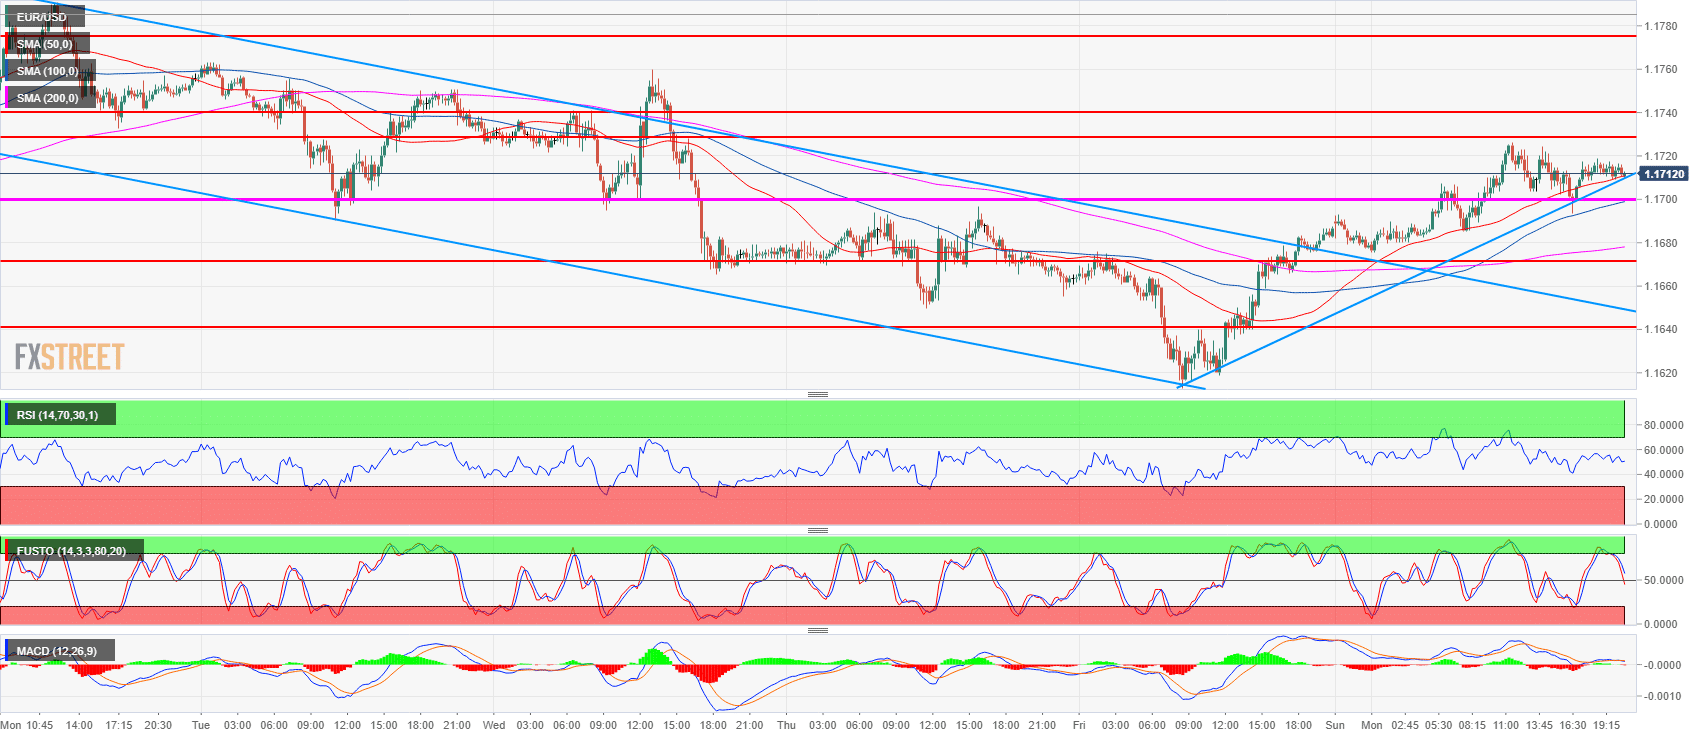
Spot rate: 1.1710
Relative change: 0.23%
High: 1.1726
Low: 1.1675
Trend: Neutral
Resistance 1: 1.1730-1.1740 area, 23.6% Fibonacci retracement from mid-April-May bear move and last week’s open.
Resistance 2: 1.1790 last week’s high
Resistance 3: 1.1851-1.1854 area, June high and 38.2% Fibonacci retracement from mid-April-May bear move
Support 1: 1.1700 figure
Support 2: 1.1672 June 27 high
Support 3: 1.1640-1.1649 area, key level and July 12 low
Support 4: 1.1613 current weekly low
Support 5: 1.1600 figure
Support 6: 1.1560 June 14 low
Support 7: 1.1508 current 2018 low
EUR/USD daily chart