- EUR/USD is bouncing from the 2019 low after the US GDP.
- European Central Bank’s (ECB) Mario Draghi will be speaking at 13:30 GMT.
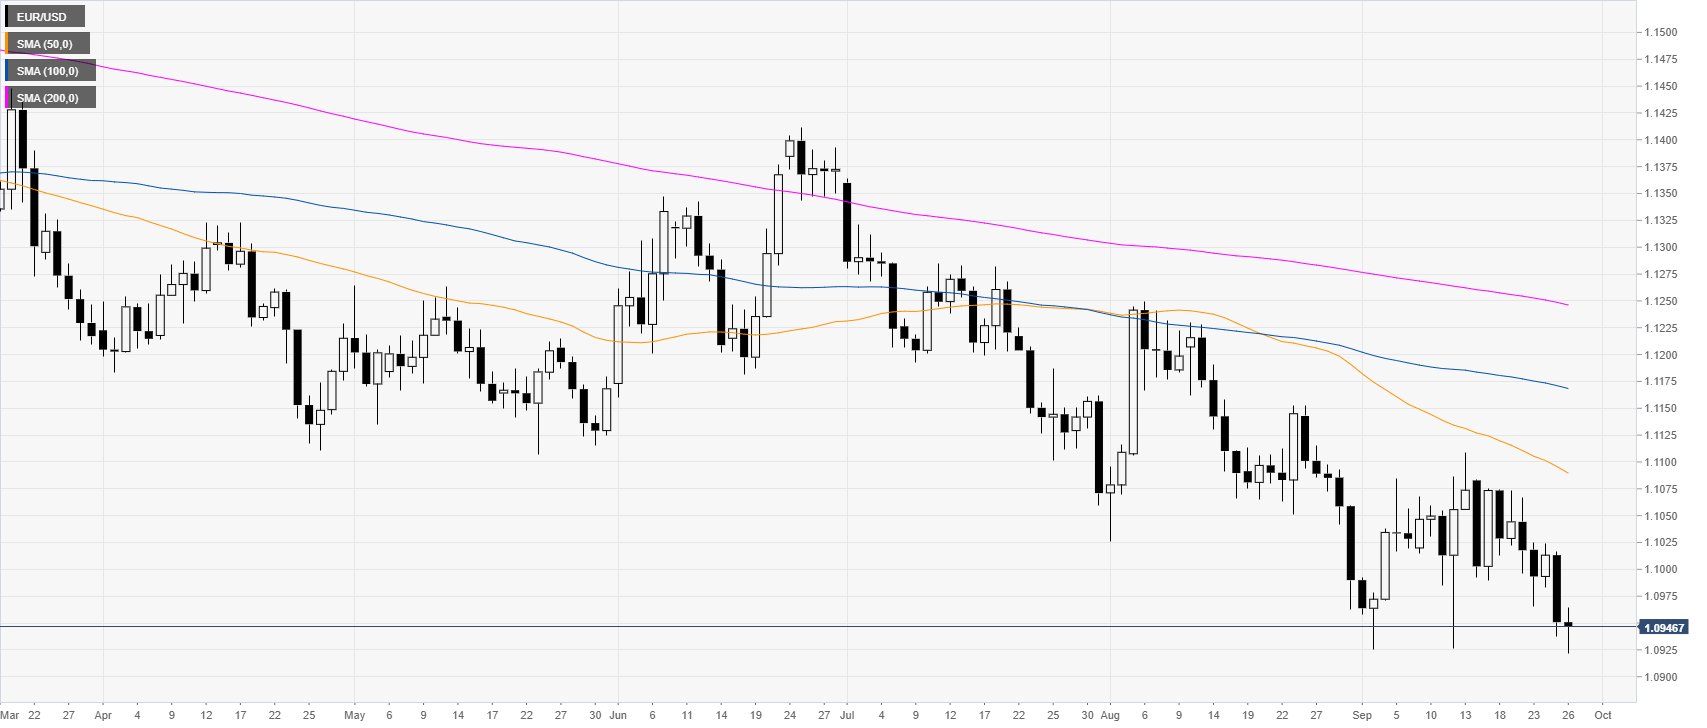
EUR/USD daily chart
The shared currency, on the daily chart, is trading in a downtrend below the main daily simple moving averages (DSMAs). The US GDP came in at 2% as expected. The Greenback weakened on the news, creating a bounce on EUR/USD. European Central Bank’s (ECB) Mario Draghi will be speaking at 13:30 GMT.
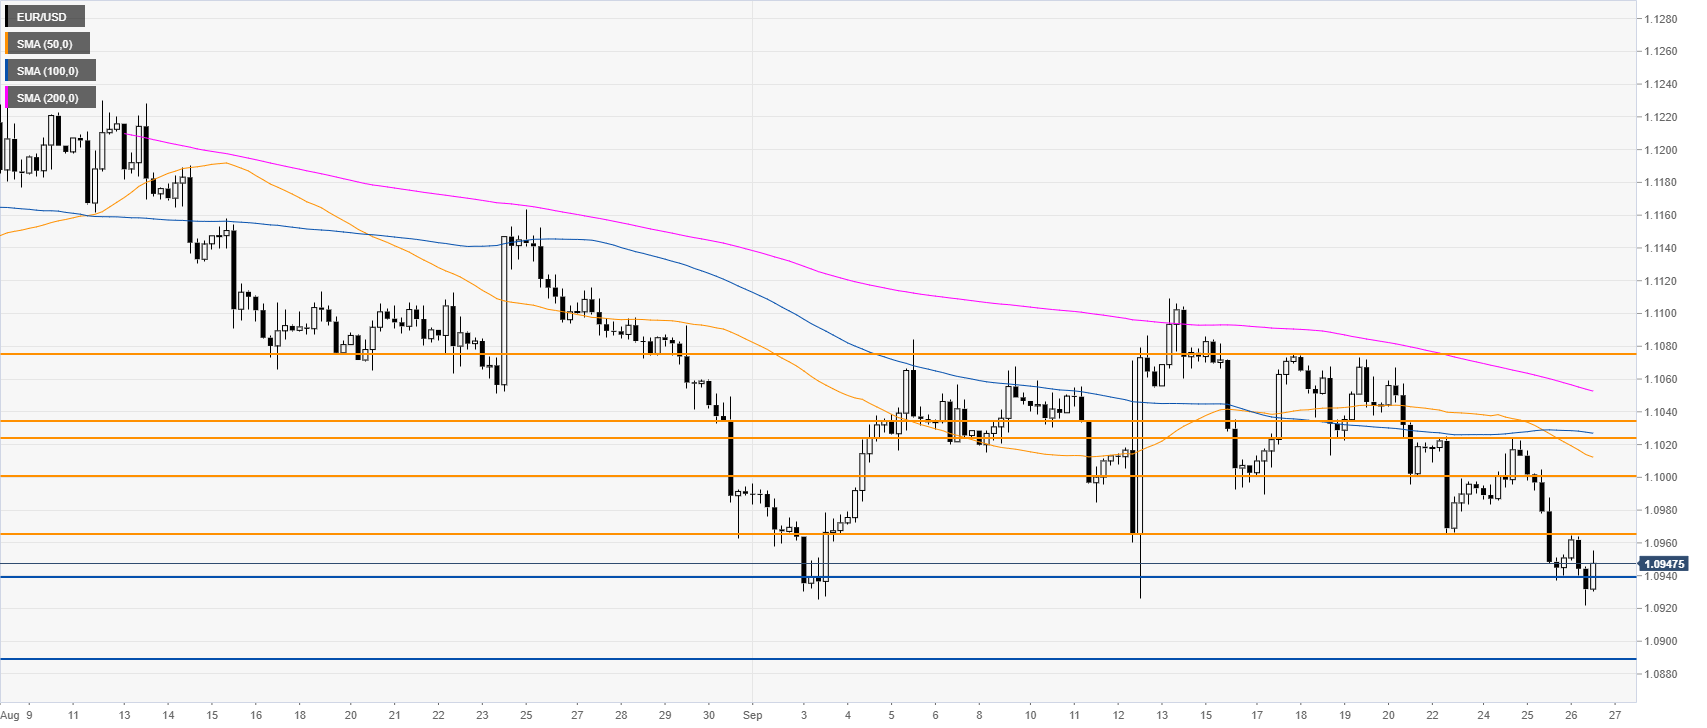
EUR/USD four-hour chart
The market is trading above the 1.0940 support level. A break below 1.0940 can expose the 1.0890 price level, according to the Technical Confluences Indicator.
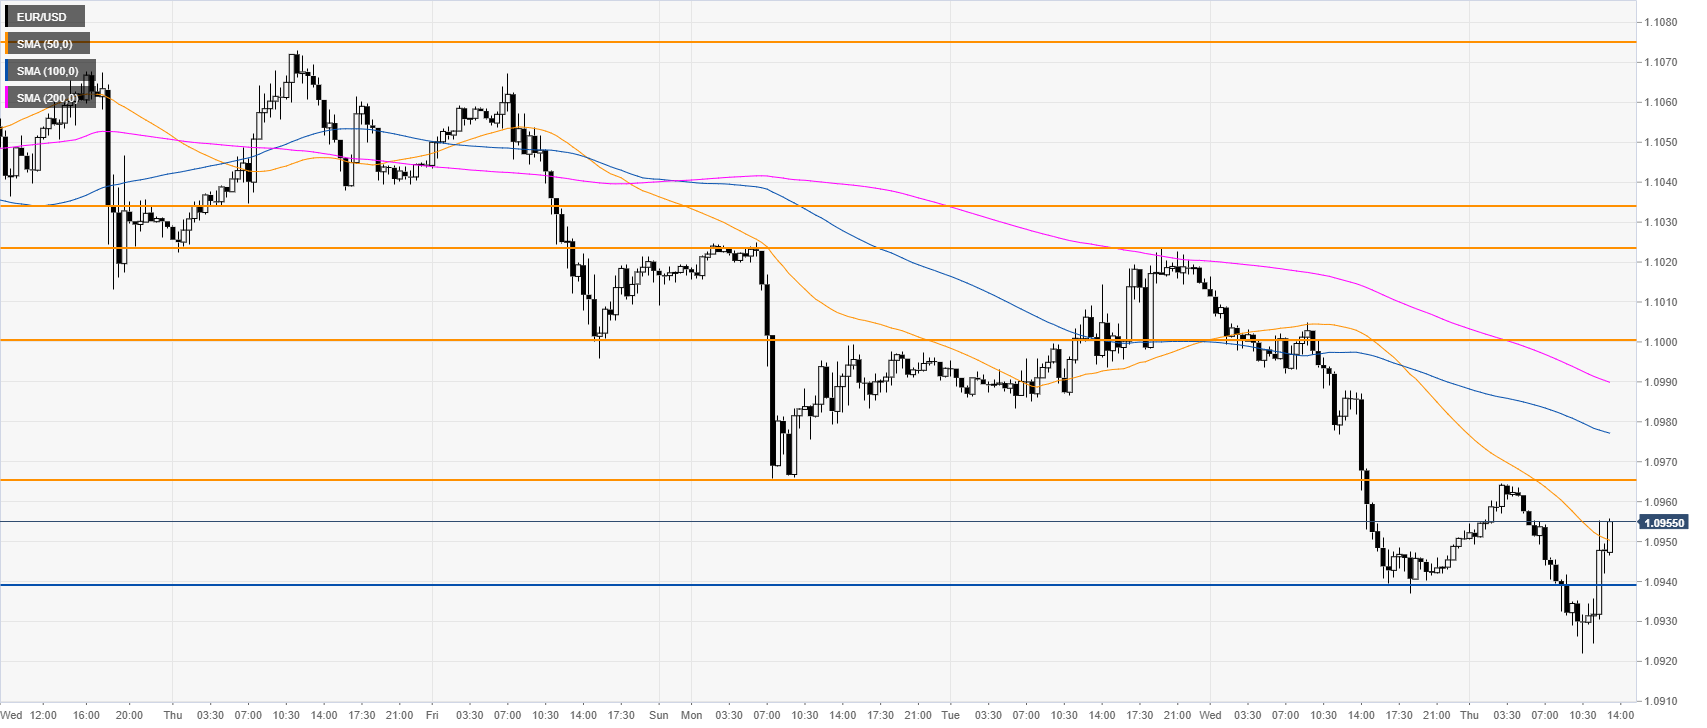
EUR/USD 30-minute chart
The Euro/Dollar exchange rate is challenging the 50 SMA on the 30-minute chart. Resistance is located at the 1.0966 resistance. A break above that level can open the door to the 1.1000 figure, according to the Technical Confluences Indicator.
Additional key levels
