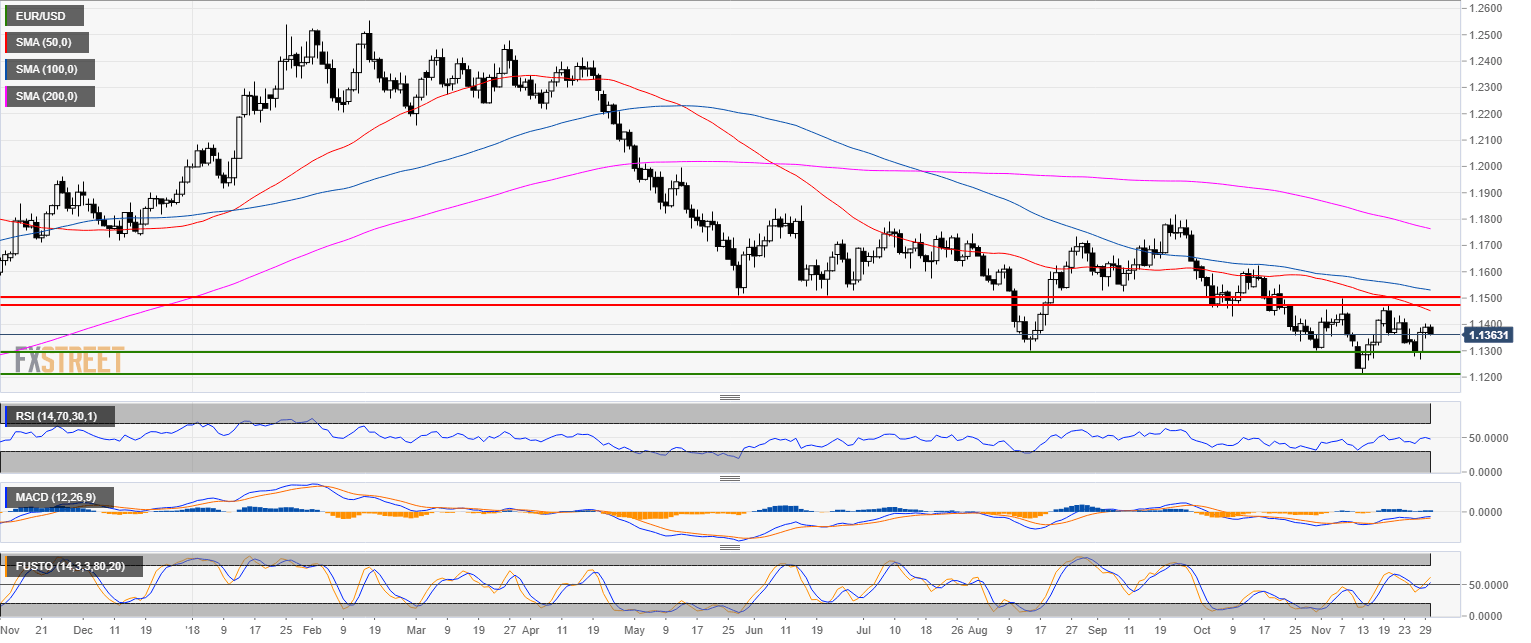
EUR/USD daily chart
- EUR/USD is trading in a bear trend below the 200-day simple moving average (SMA).
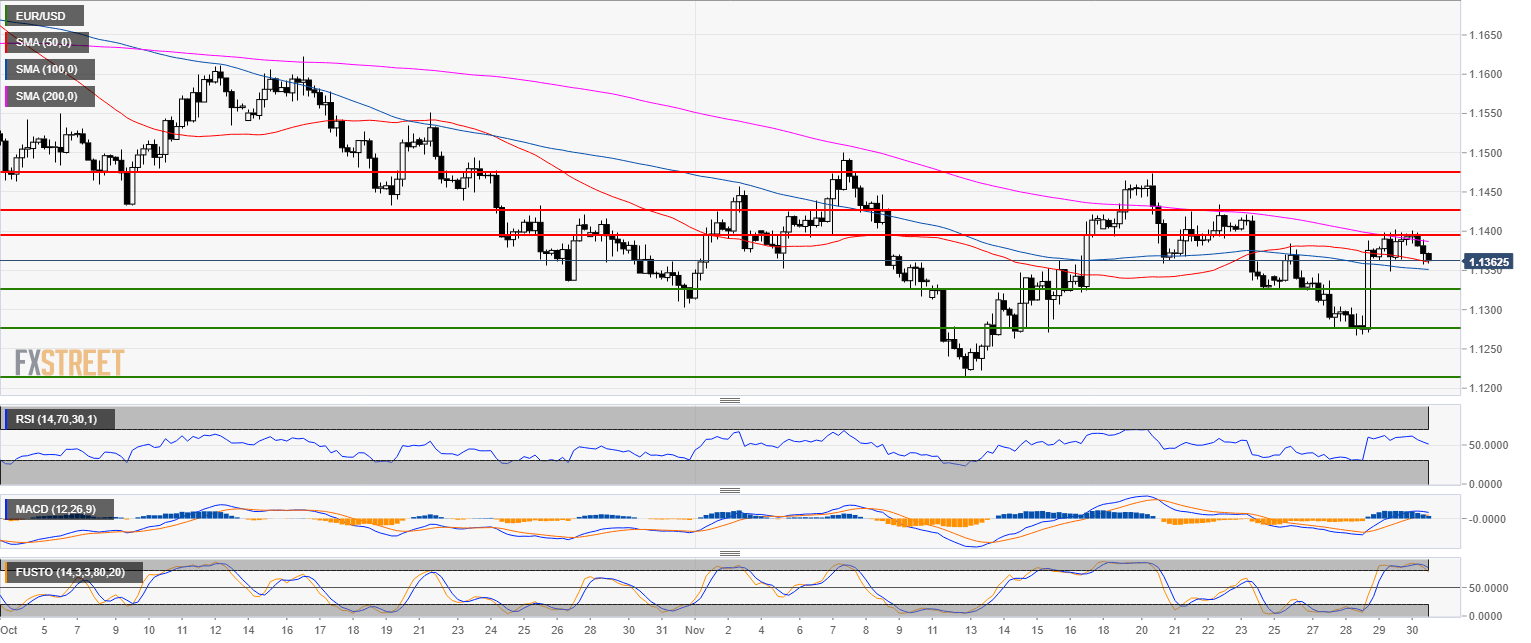
EUR/USD 4-hour chart
- EUR/USD found resistance at 1.1400 figure as technical indicators are starting to decelerate.
- EUR/USD is currently trapped between the 100 and 200 SMA.
EUR/USD 30-minute chart
- EUR/USD is trading below the 50 and 100 SMA as the technical indicators turned bearish.
- 1.1320 seems to be the next key support to the downside while 1.1400 is the level to beat for bulls.
is 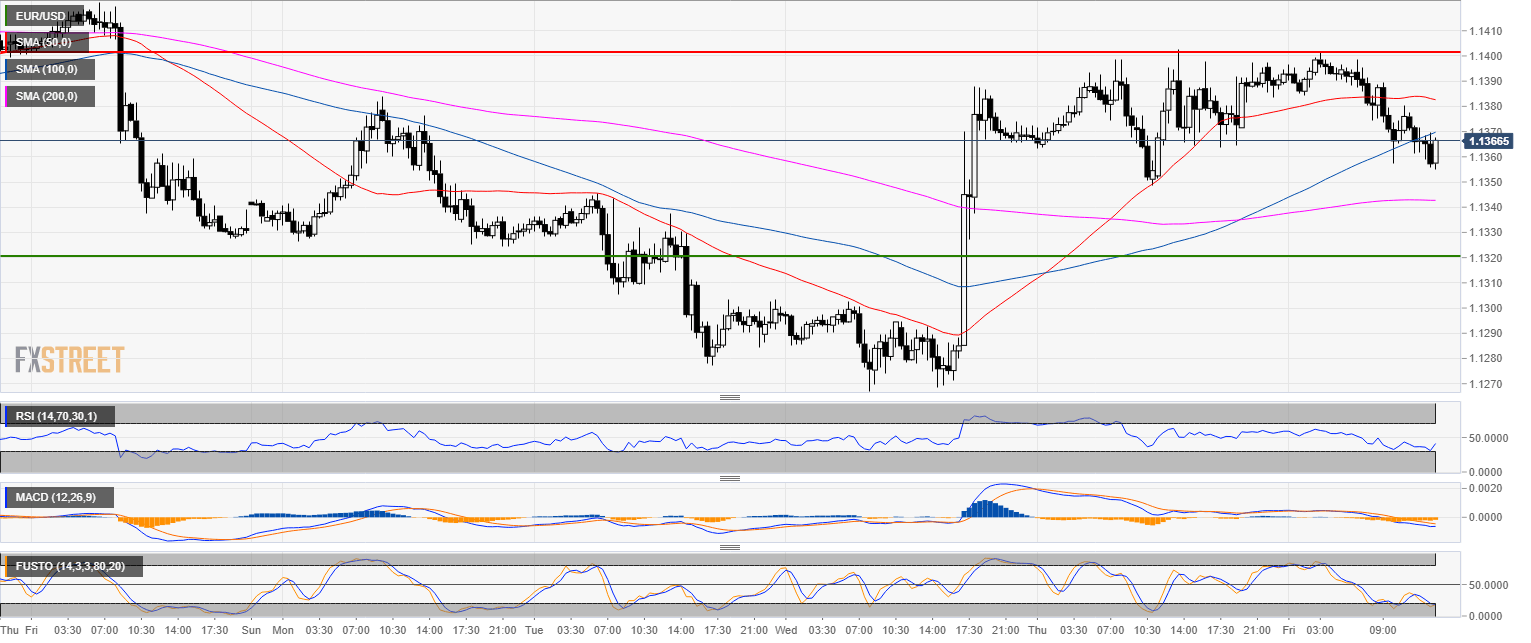
Additional key levels
EUR/USD
Overview:
Today Last Price: 1.1357
Today Daily change: -33 pips
Today Daily change %: -0.290%
Today Daily Open: 1.139
Trends:
Previous Daily SMA20: 1.1364
Previous Daily SMA50: 1.146
Previous Daily SMA100: 1.1534
Previous Daily SMA200: 1.177
Levels:
Previous Daily High: 1.1402
Previous Daily Low: 1.1348
Previous Weekly High: 1.1473
Previous Weekly Low: 1.1328
Previous Monthly High: 1.1625
Previous Monthly Low: 1.1302
Previous Daily Fibonacci 38.2%: 1.1382
Previous Daily Fibonacci 61.8%: 1.1369
Previous Daily Pivot Point S1: 1.1358
Previous Daily Pivot Point S2: 1.1326
Previous Daily Pivot Point S3: 1.1304
Previous Daily Pivot Point R1: 1.1412
Previous Daily Pivot Point R2: 1.1434
Previous Daily Pivot Point R3: 1.1466
