- EUR/USD is easing from three-week highs in the New York session.
- The US Core Consumer Price Index (CPI) matched analysts’ expectations at 2.4% YoY.
- Earlier in Europe, the European Central Bank’s (ECB) minutes showed opposition to QE, sending EUR/USD above the 1.1000 figure.
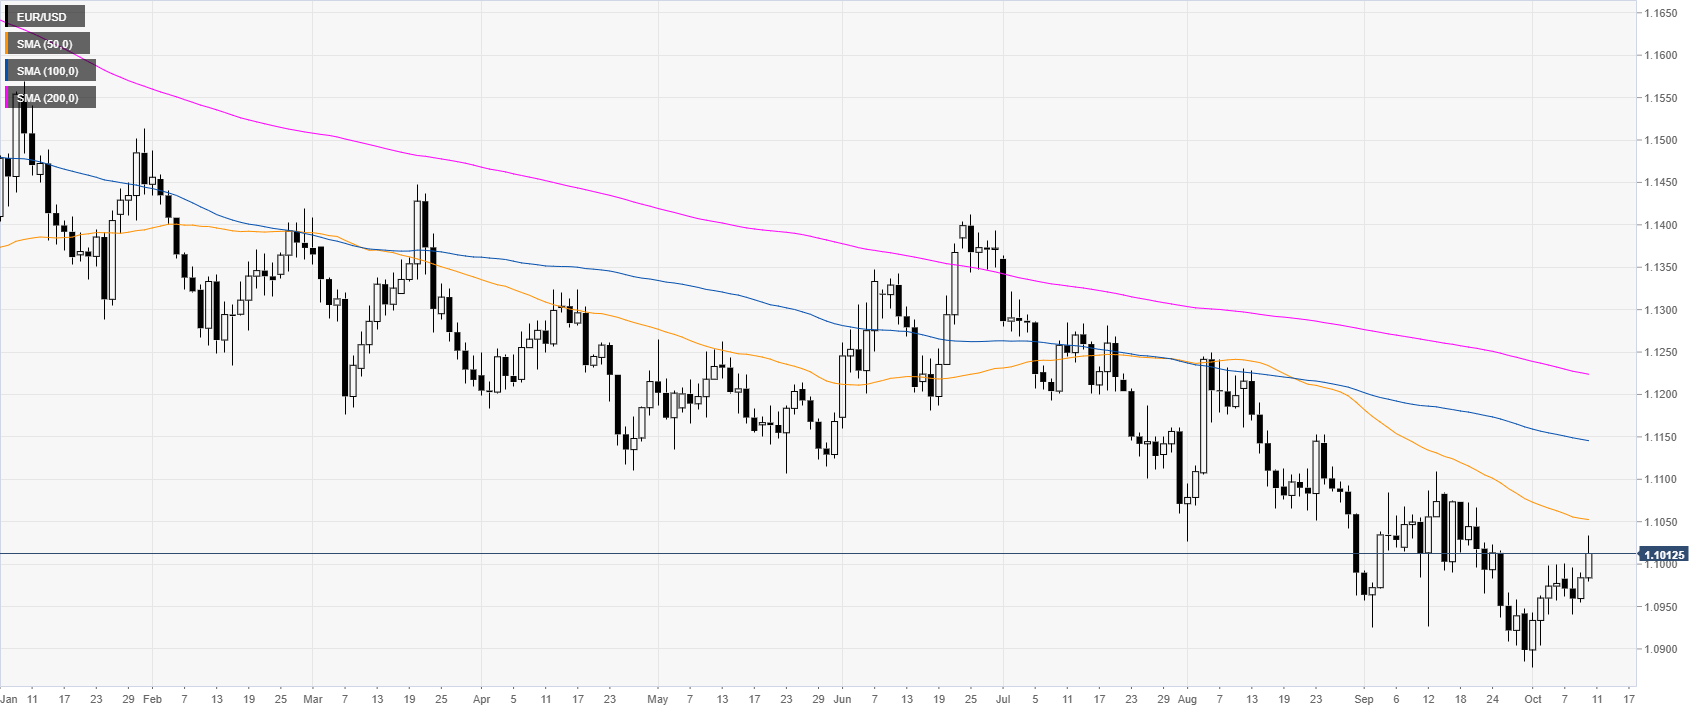
EUR/USD daily chart
On the daily chart, the common currency is trading in a bear trend below the main daily simple moving averages (DSMAs). Earlier in Europe, the European Central Bank’s (ECB) minutes showed opposition to QE sending EUR/USD above the 1.1000 figure while in the New York session, the US Core Consumer Price Index (CPI) came out at 2.4% YoY matching forecasts.
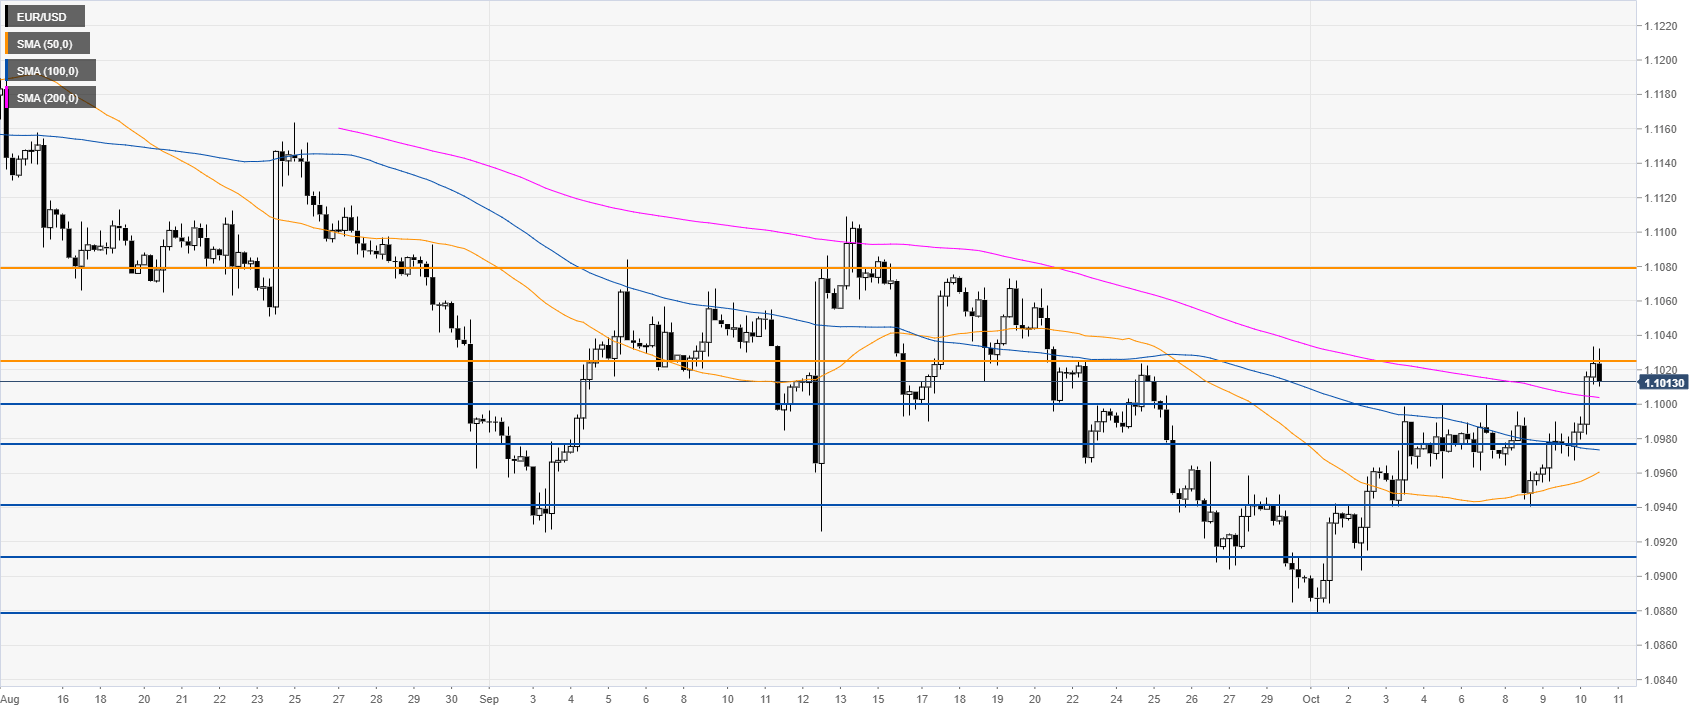
EUR/USD four-hour chart
EUR/USD is correcting slightly below 1.1025 resistance. The market is trading above its main SMAs, suggesting bullish momentum in the medium term. If the market holds above the 1.1000/1.1025 zone, the market can attempt to reach the 1.1080 on the way up, according to the Technical Confluences Indicator.
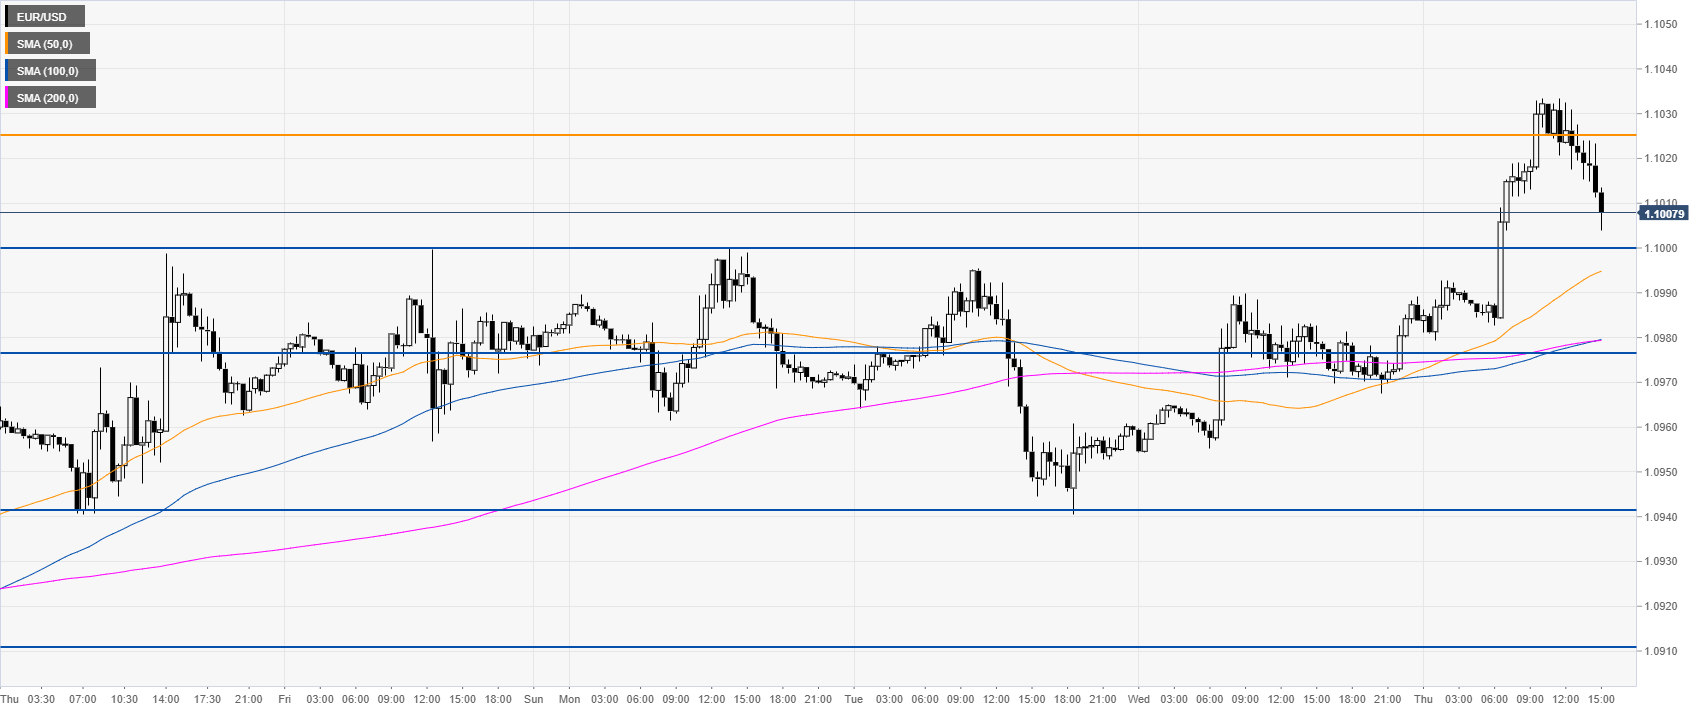
EUR/USD 30-minute chart
EUR/USD is trading above the main SMAs, suggesting bullish momentum in the near term. Support can be seen at the 1.1000 and 1.0976 support level. A daily close below the 1.1000 figure would alleviate the short term bullish bias.
Additional key levels
