- EUR/USD is drifting below the 1.1098 level as the New York session comes to an end.
- The level to beat for sellers is at the 1.1080 support.
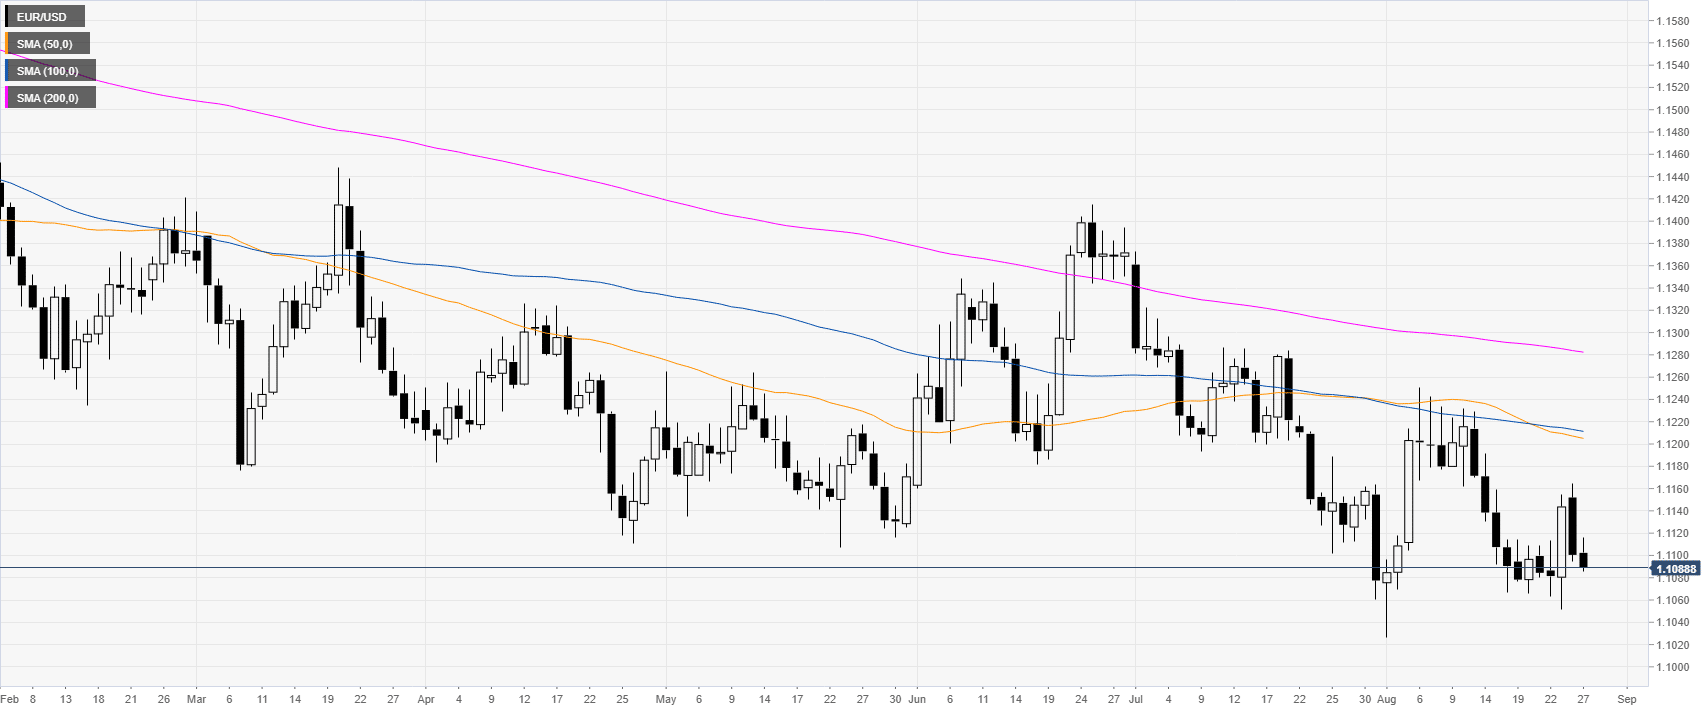
EUR/USD daily chart
On the daily time-frame, the common currency is trading in a bear trend below its main daily simple moving averages (DSMAs). The market is down for the second day in a row.
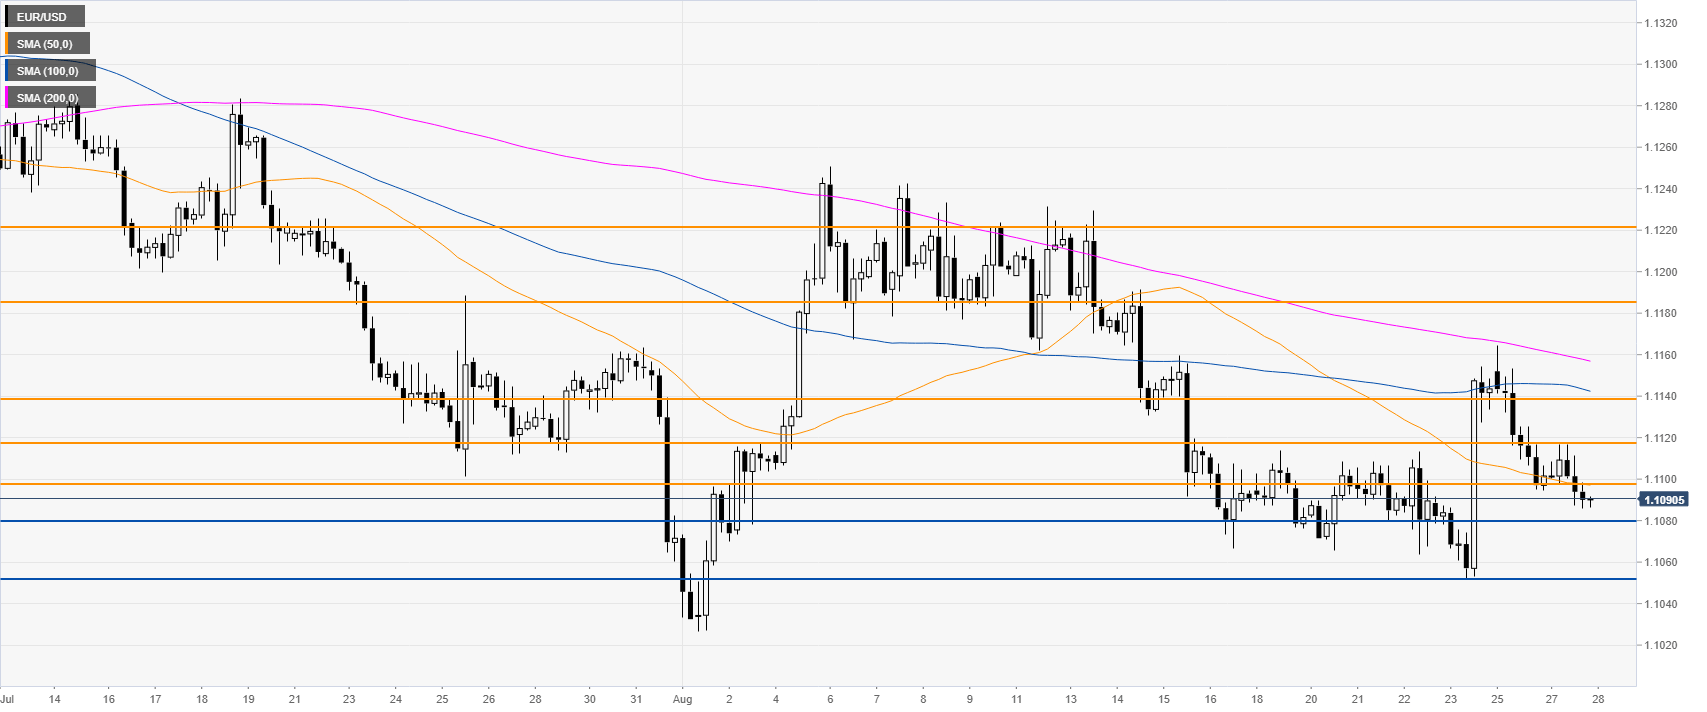
EUR/USD 4-hour chart
Fiber is about to close Tuesday below the 1.1098 level. If the sellers keep the pressure on, the market may decline towards the 1.1080 and 1.1052 levels, according to the Technical Confluences Indicator.
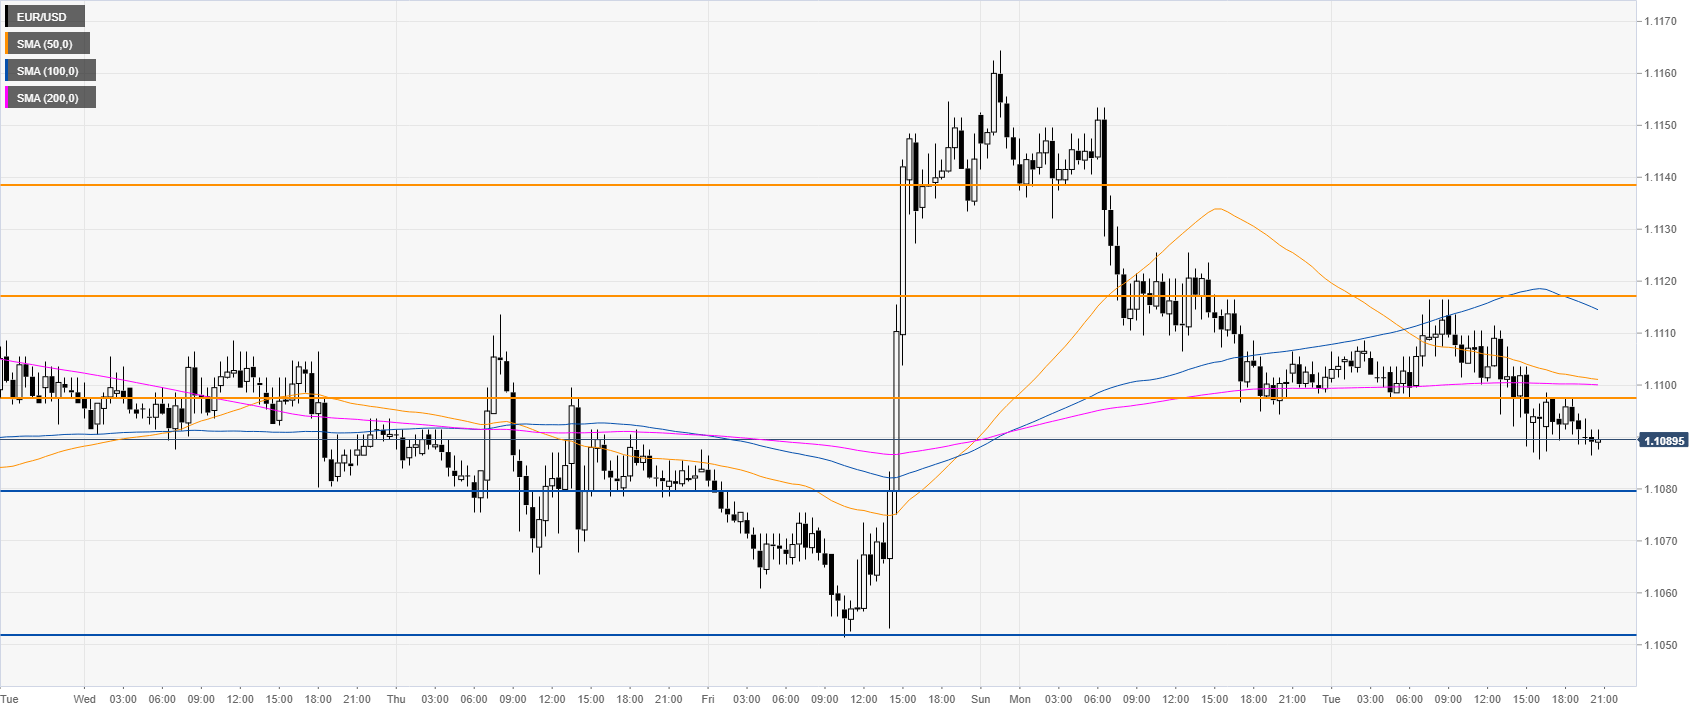
EUR/USD 30-minute chart
EUR/USD is trading, near the daily lows below the main SMAs suggesting a bearish momentum in the near term. The bears’ move lacks commitment; therefore, it remains to be seen how the sellers will sustain the current move on Wednesday. A move back above 1.1098 could be seen as a sign of bearish weakness in the short term. Immediate resistance is seen at 1.1098, 1.1117 and 1.1134 levels, according to the Technical Confluences Indicator.
Additional key levels


