- EUR/USD traded as high as 1.1097 but reversed course and is now virtually unchanged on a daily basis.
- The level to beat for bulls is the 1.1083 resistance.
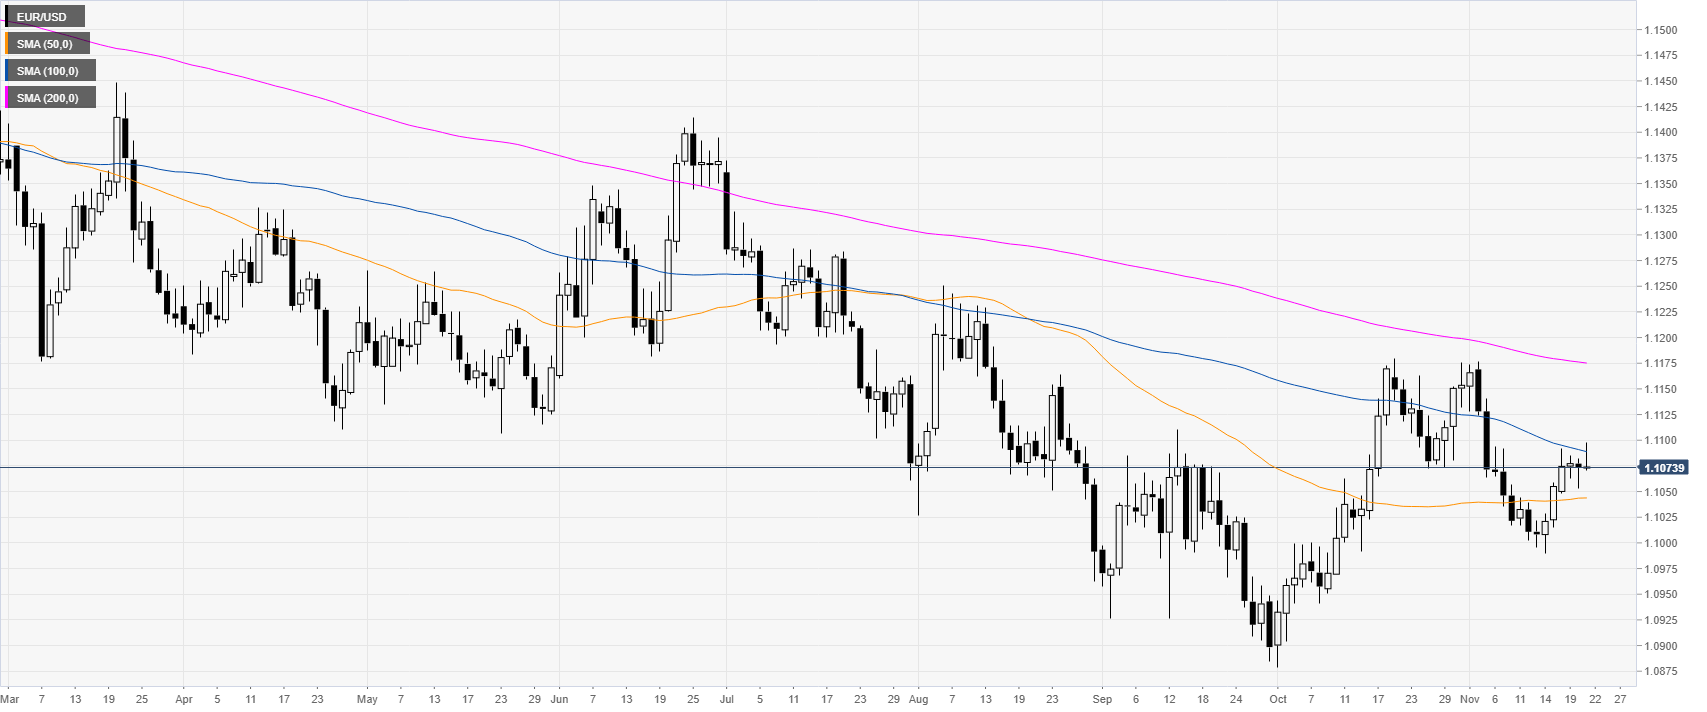
EUR/USD daily chart
Euro/dollar, on the daily chart, is trading in a bear trend below its downward sloping 100 and 200-day simple moving averages (DMAs). The market is trapped in a range for the third consecutive day.
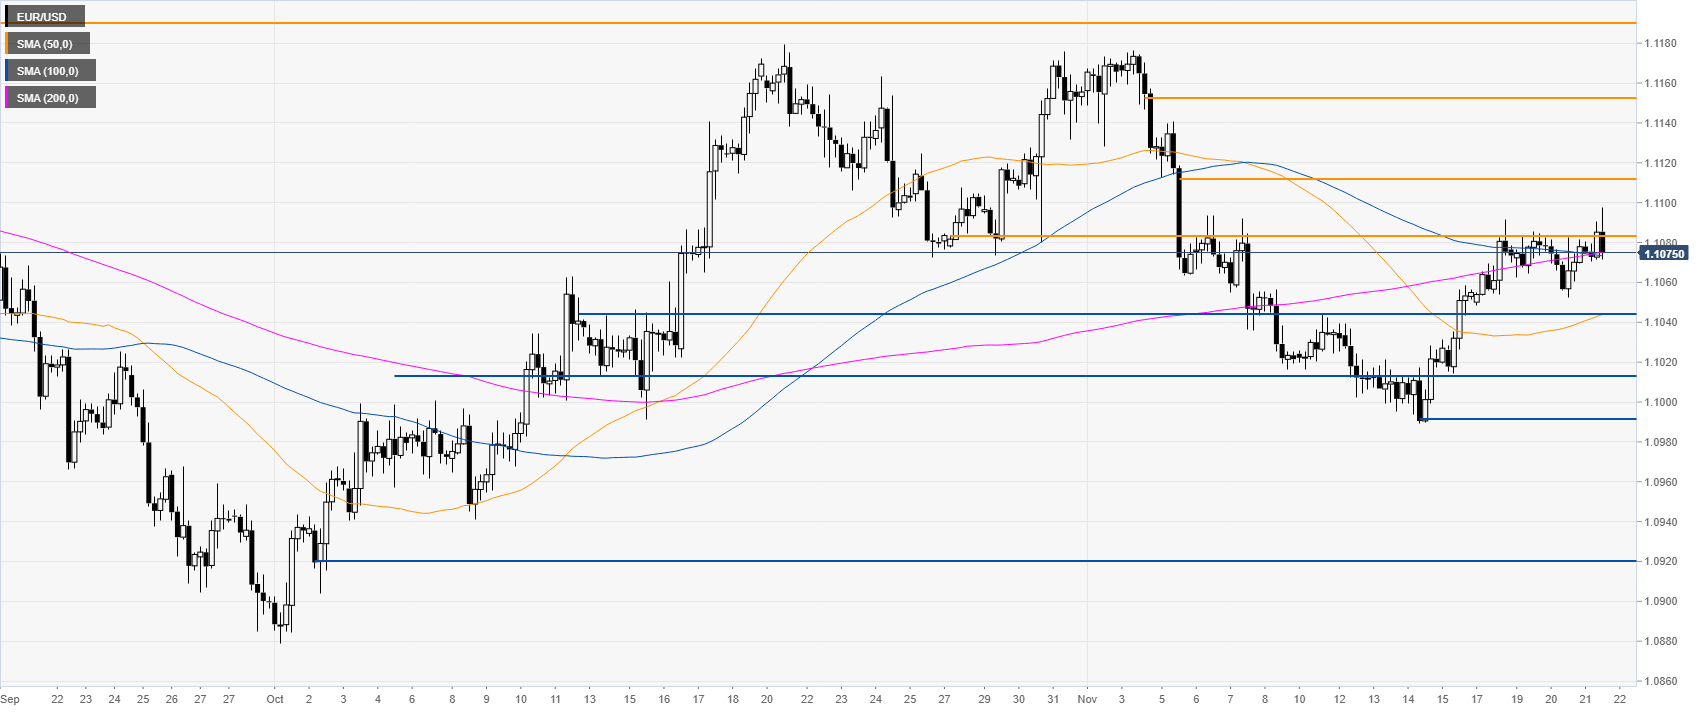
EUR/USD four-hour chart
The spot tried to break above the 1.1083 but is currently being rejected in the New York session. A daily close above the level could lead to the 1.1112 and 1.1152 resistances, according to the Technical Confluences Indicator.
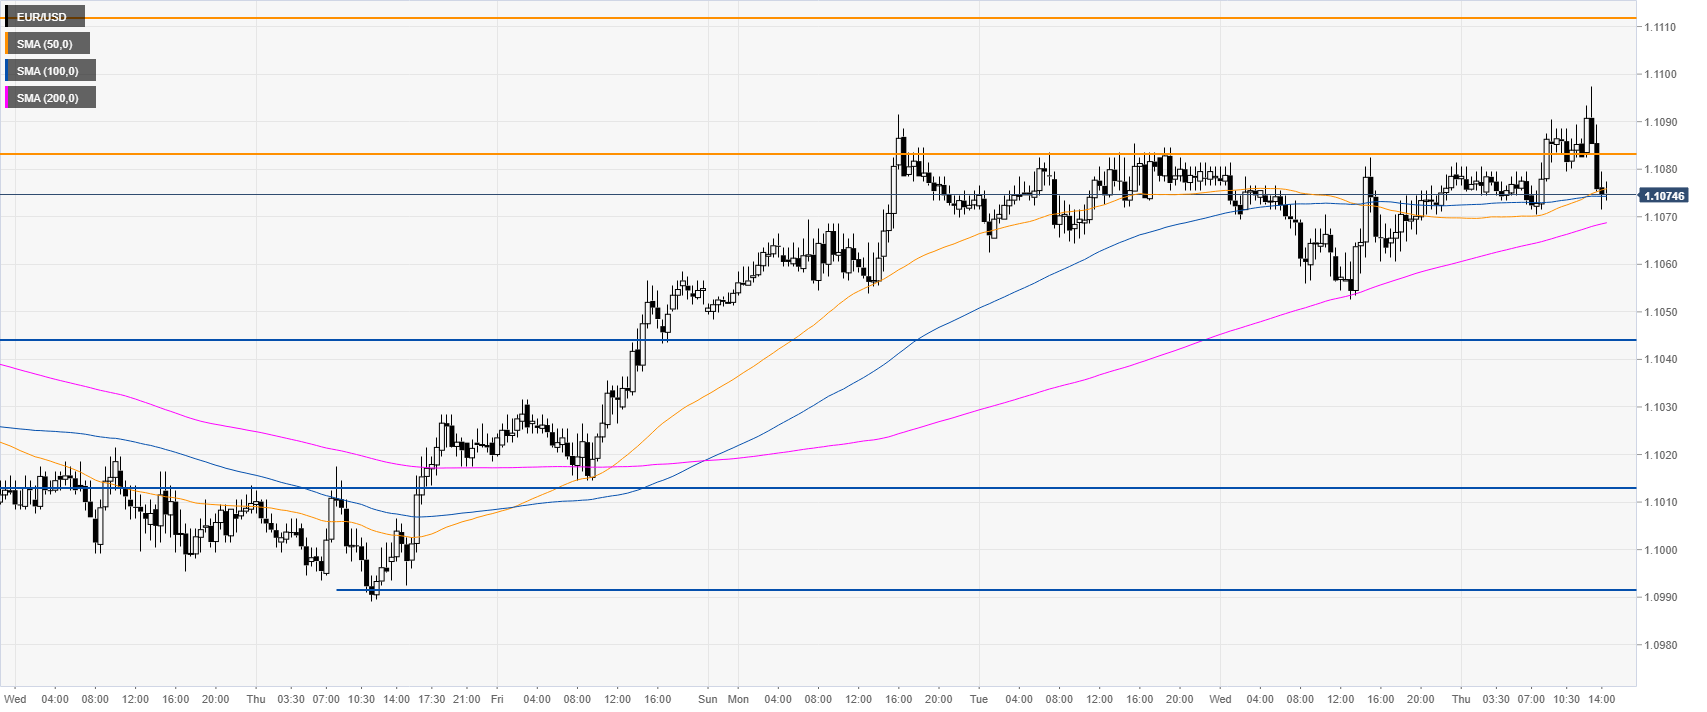
EUR/USD 30-minute chart
EUR/USD is trading above the 200 SMA, suggesting a bullish bias in the near term. The main support is seen at the 1.1043 level. However, a daily close below this point could lead to a secline towards the 1.1014 and 1.0991 levels, according to the Technical Confluences Indicator.
Additional key levels
