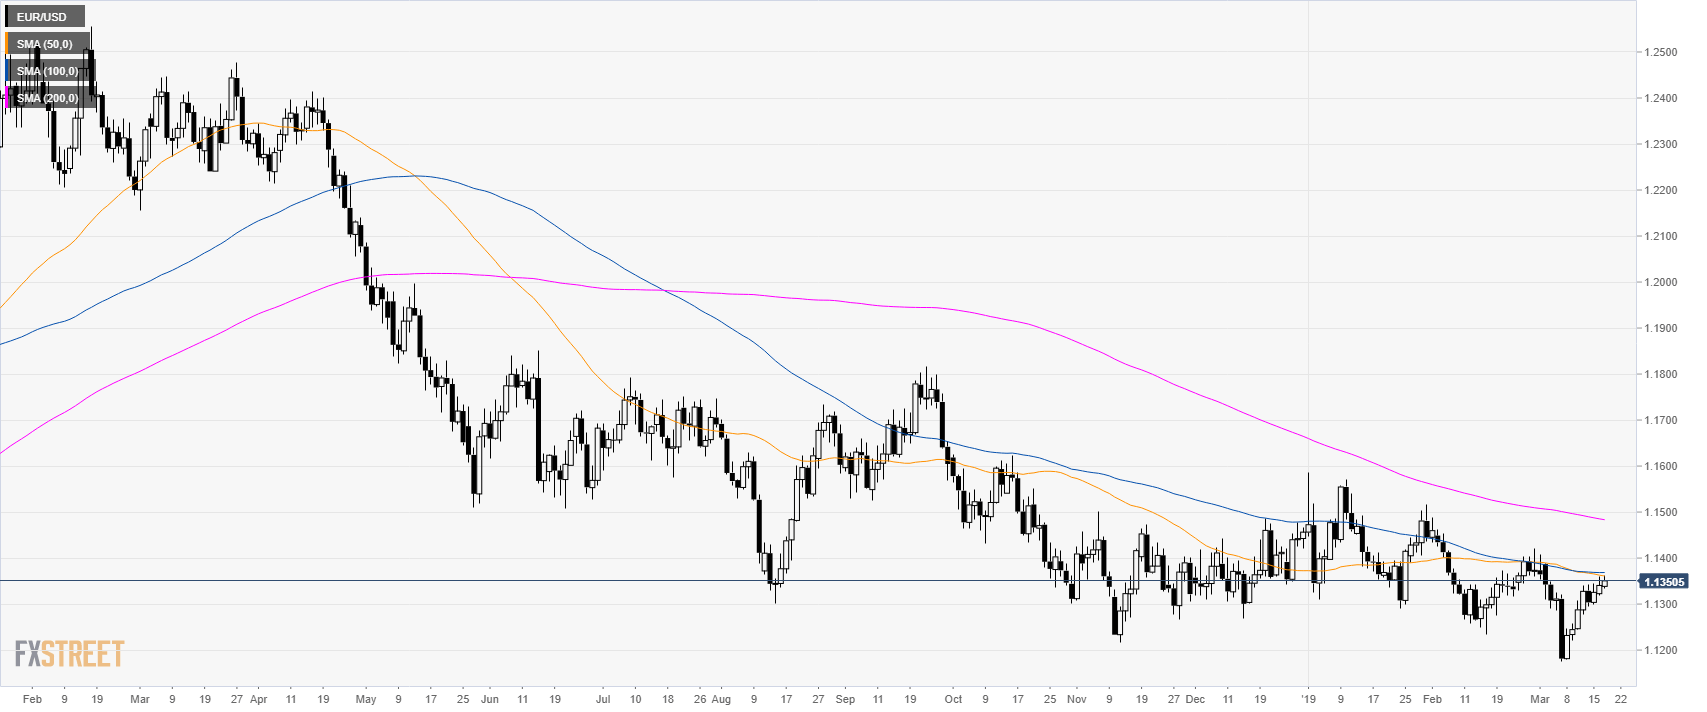
EUR/USD daily chart
- EUR/USD is trading in a bear trend below its main simple moving averages (SMAs).
- The 100 SMA is at 1.1368, a break above it would be seen as bullish.
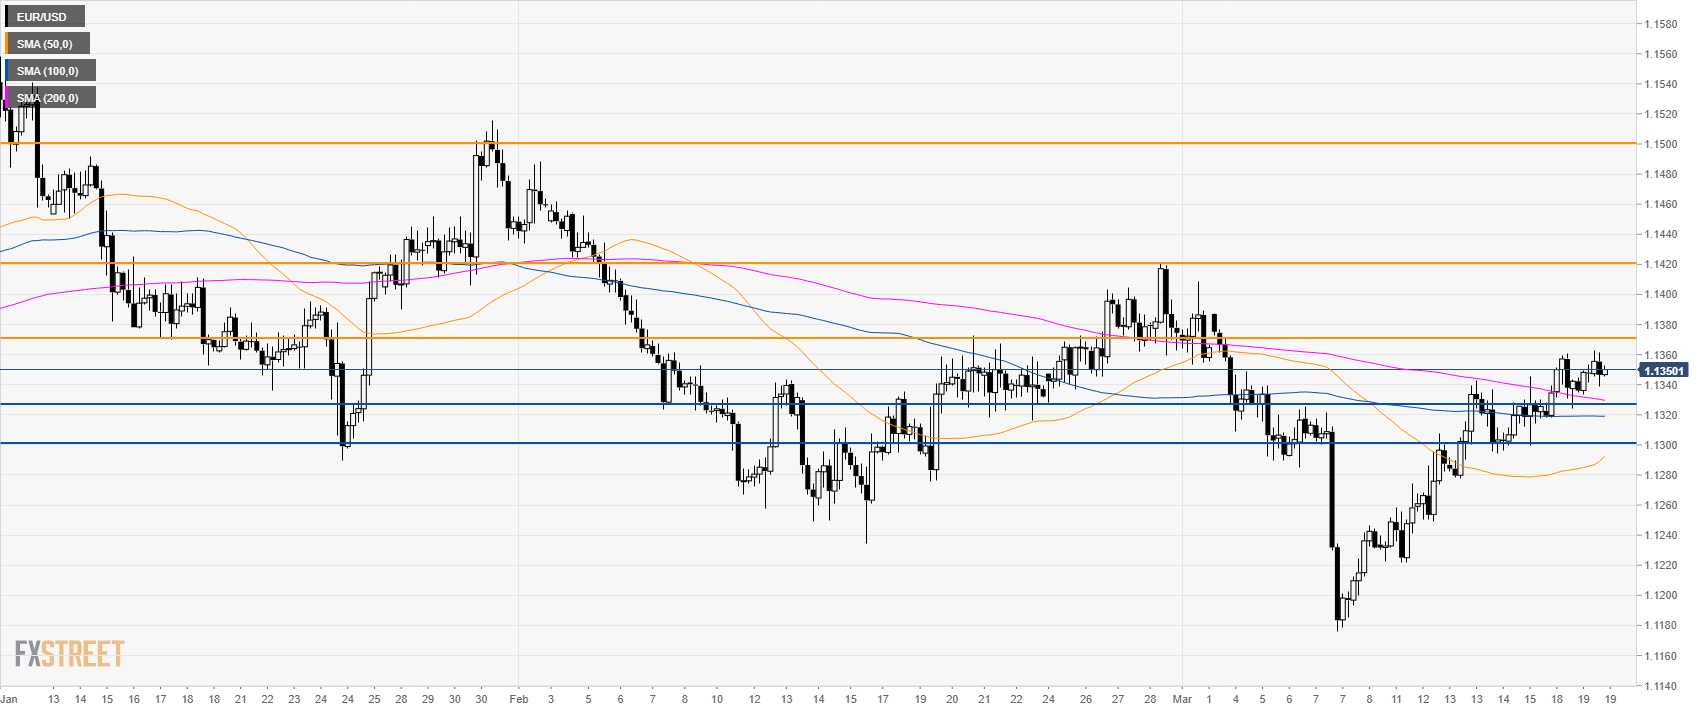
EUR/USD 4-hour chart
- EUR/USD is trading above its main SMAs suggesting bullish momentum in the medium-term.
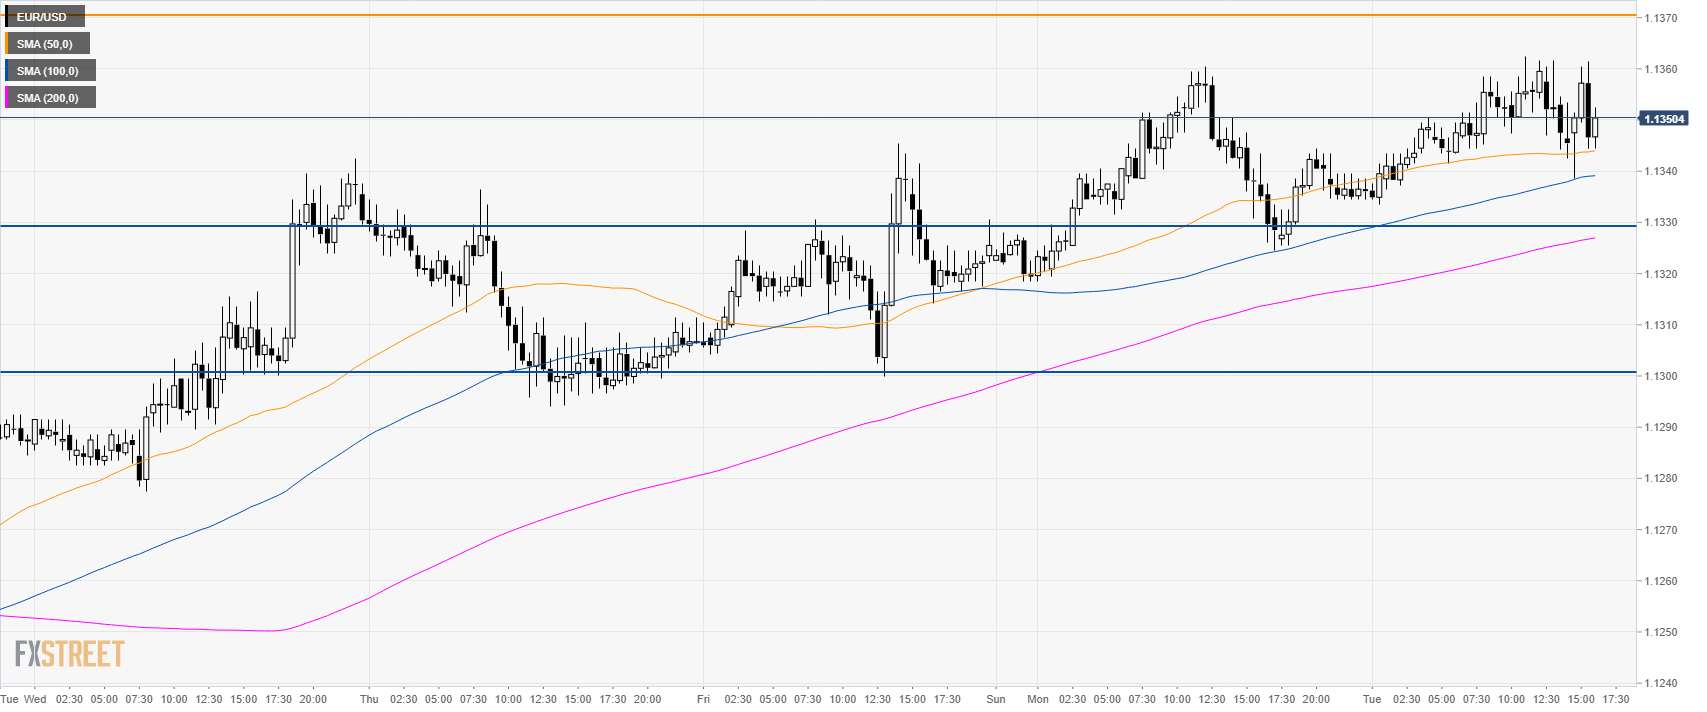
EUR/USD 30-minute chart
- EUR/USD is trading above its main SMAs suggesting bullish momentum in the short-term.
- A break above 1.1370 can lead to 1.1420 and 1.1500 figure.
- Looking to the downside, support is at 1.1330 and 1.1300 figure.
Additional key levels
EUR/USD
Overview:
Today Last Price: 1.1346
Today Daily change: 6 pips
Today Daily change %: 0.05%
Today Daily Open: 1.134
Trends:
Daily SMA20: 1.1321
Daily SMA50: 1.1363
Daily SMA100: 1.1368
Daily SMA200: 1.1485
Levels:
Previous Daily High: 1.136
Previous Daily Low: 1.1318
Previous Weekly High: 1.1346
Previous Weekly Low: 1.1222
Previous Monthly High: 1.1489
Previous Monthly Low: 1.1234
Daily Fibonacci 38.2%: 1.1344
Daily Fibonacci 61.8%: 1.1335
Daily Pivot Point S1: 1.1319
Daily Pivot Point S2: 1.1298
Daily Pivot Point S3: 1.1277
Daily Pivot Point R1: 1.1361
Daily Pivot Point R2: 1.1382
Daily Pivot Point R3: 1.1403
