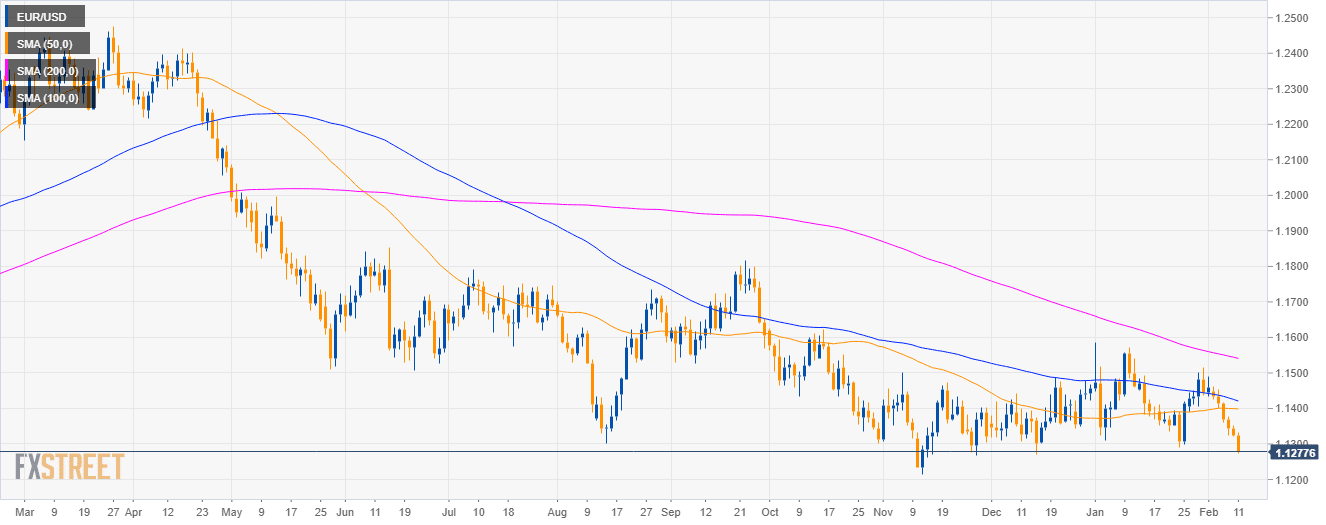
EUR/USD daily chart
- EUR/USD is trading in a bear trend below the 200-day simple moving average (SMA).
- EUR/USD reached its lowest point since mid-December 2018.
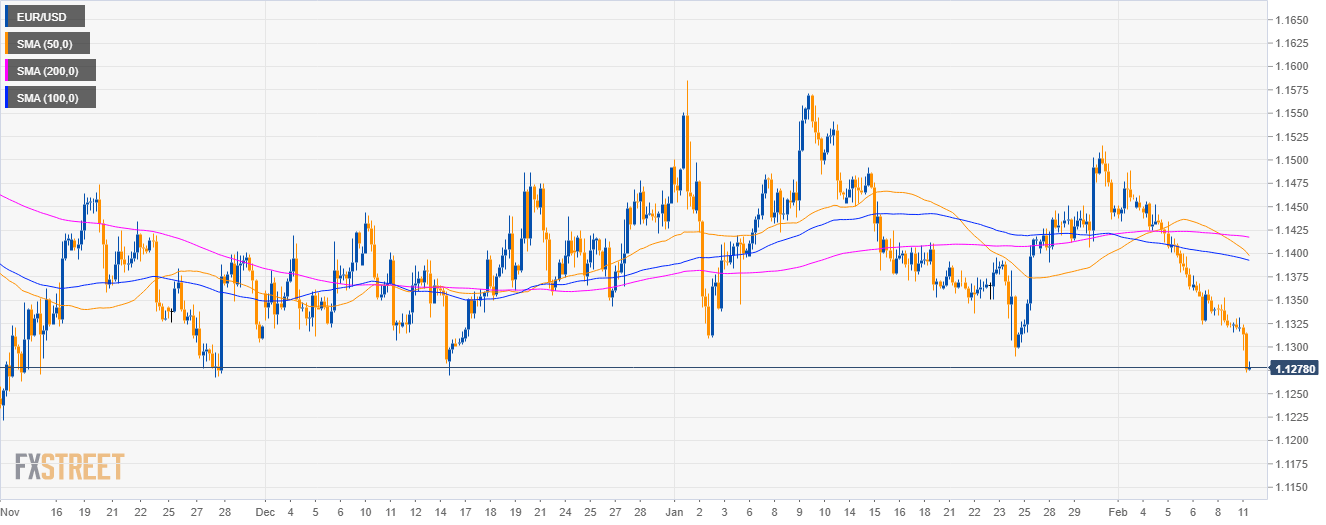
EUR/USD 4-hour chart
- EUR/USD is trading below its main SMAs suggesting bearish momentum in the medium-term.
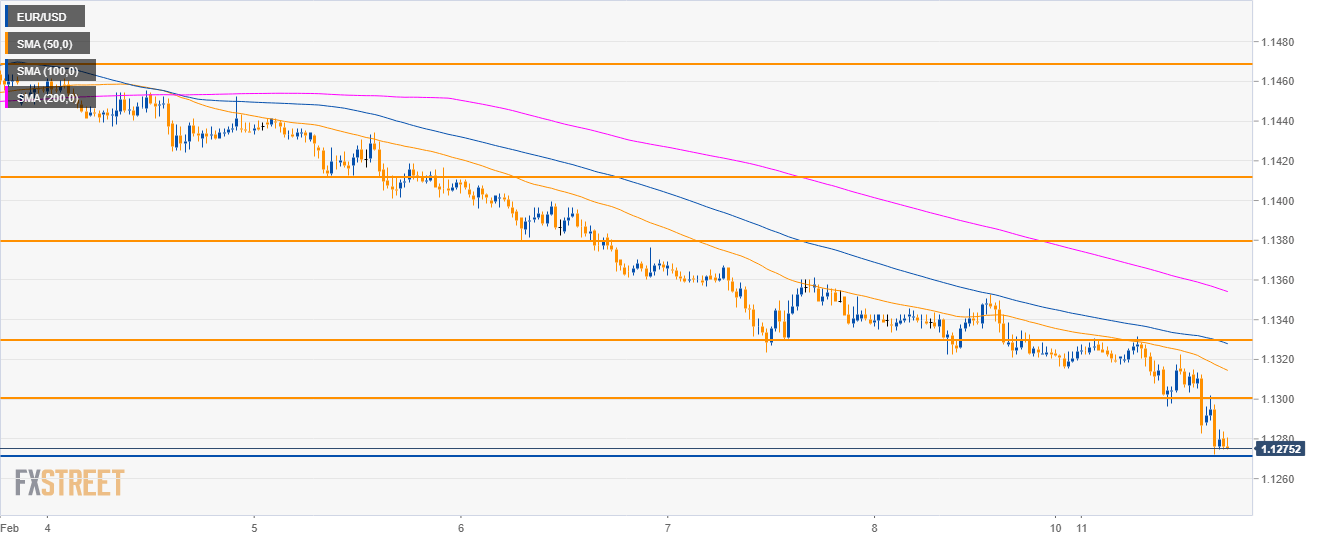
EUR/USD 30-minute chart
- EUR/USD is evolving below its main SMAs suggesting bearish momentum.
- If bears can break 1.2700 multi-month support, then 1.1215 (2018 low) can be on the cards.
- Resistance is seen at 1.1300 figure and 1.1350 level.
Additional key levels
EUR/USD
Overview:
Today Last Price: 1.1276
Today Daily change: -46 pips
Today Daily change %: -0.41%
Today Daily Open: 1.1322
Trends:
Daily SMA20: 1.1399
Daily SMA50: 1.14
Daily SMA100: 1.1425
Daily SMA200: 1.1544
Levels:
Previous Daily High: 1.1353
Previous Daily Low: 1.132
Previous Weekly High: 1.1462
Previous Weekly Low: 1.132
Previous Monthly High: 1.1586
Previous Monthly Low: 1.1289
Daily Fibonacci 38.2%: 1.1333
Daily Fibonacci 61.8%: 1.134
Daily Pivot Point S1: 1.1311
Daily Pivot Point S2: 1.13
Daily Pivot Point S3: 1.1279
Daily Pivot Point R1: 1.1343
Daily Pivot Point R2: 1.1364
Daily Pivot Point R3: 1.1375
