- EUR/USD reversed earlier intraday gains on Thursday.
- The level to beat for sellers is the 1.1043 support.
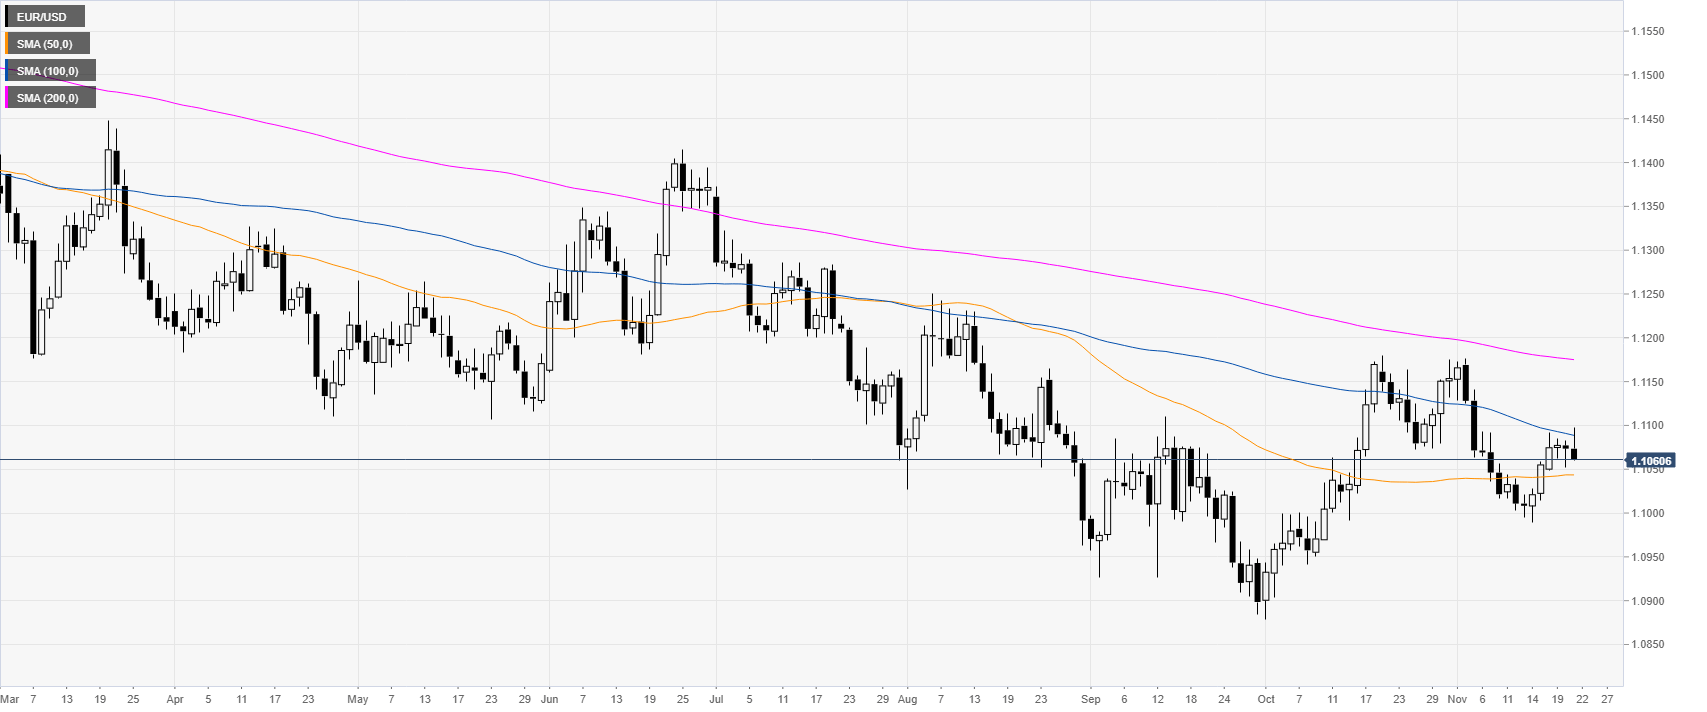
EUR/USD daily chart
Euro/Dollar, on the daily chart, is trading in a bear trend below downward sloping 100 and 200-day simple moving averages (DMAs). This Thursday, the market rejected the 1.1100 handle in the New York session.
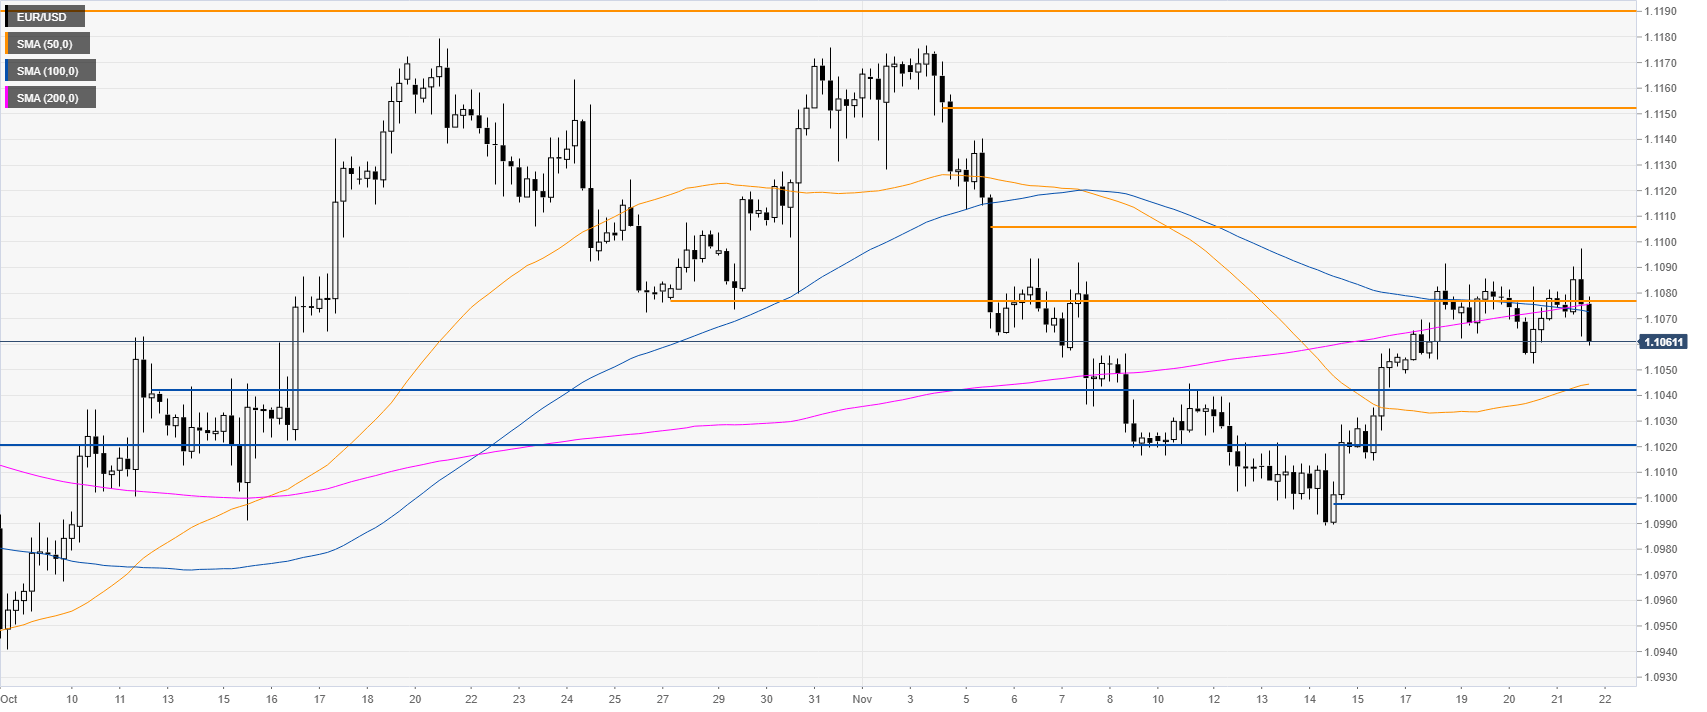
EUR/USD four-hour chart
The spot is trading below the 1.1077 resistance and the 100/200 SMAs on the four-hour time frame. The false bull breakout would gain credibility if the market closed below the 1.1043 on a daily closing basis. The primary levels to watch on the way down are likely located at the 1.1020, 1.0997 price levels, according to the Technical Confluences Indicator.
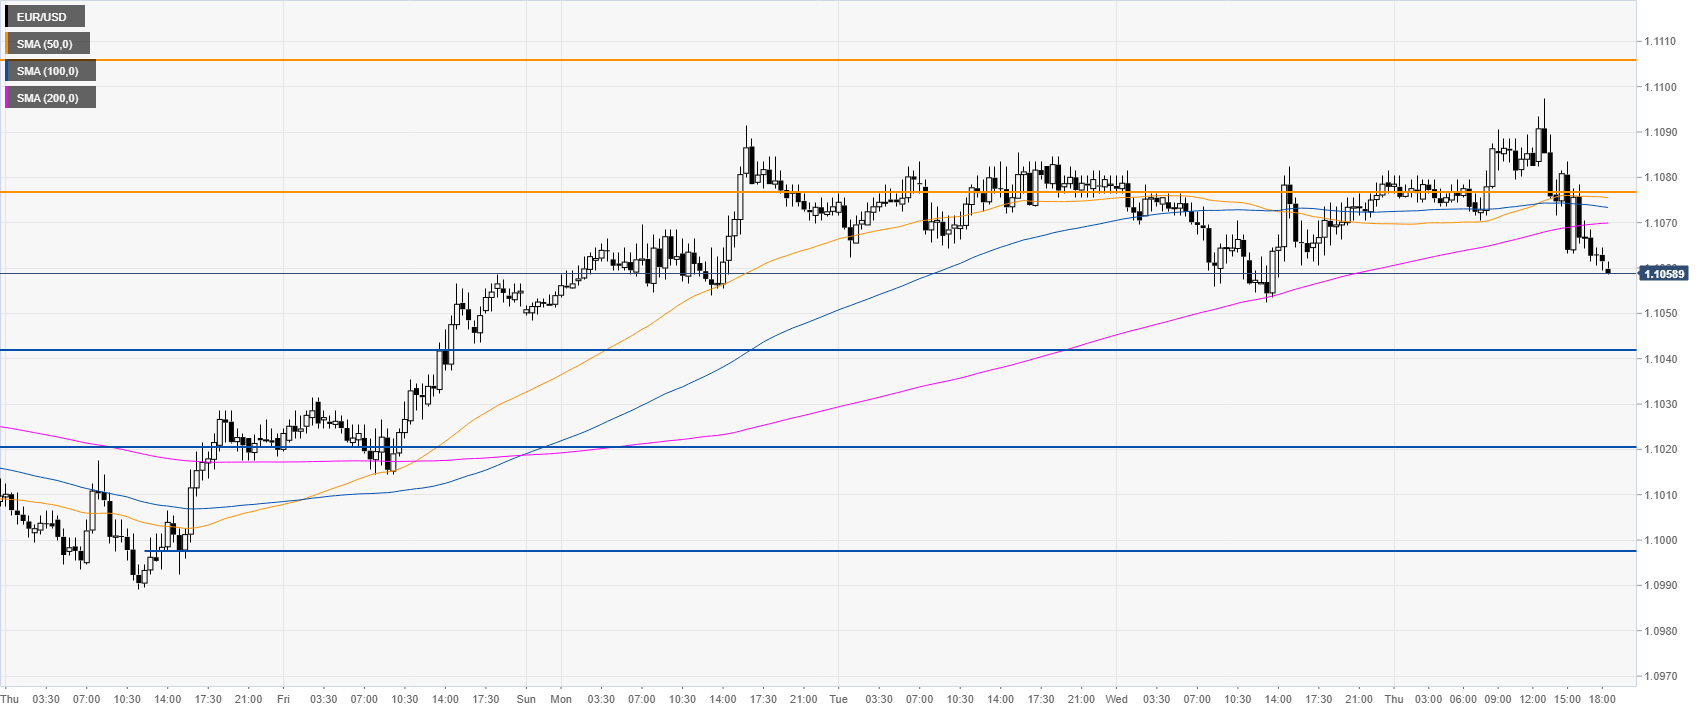
EUR/USD 30-minute chart
The fiber is trading below its main SMAs, suggesting a bearish momentum in the near term. The main resistances on the way up are the 1.1077, 1.1106 and the 1.1152 levels, according to the Technical Confluences Indicator. However, a daily close above the 1.1106 level would be seen as bullish for EUR/USD.
Additional key levels
