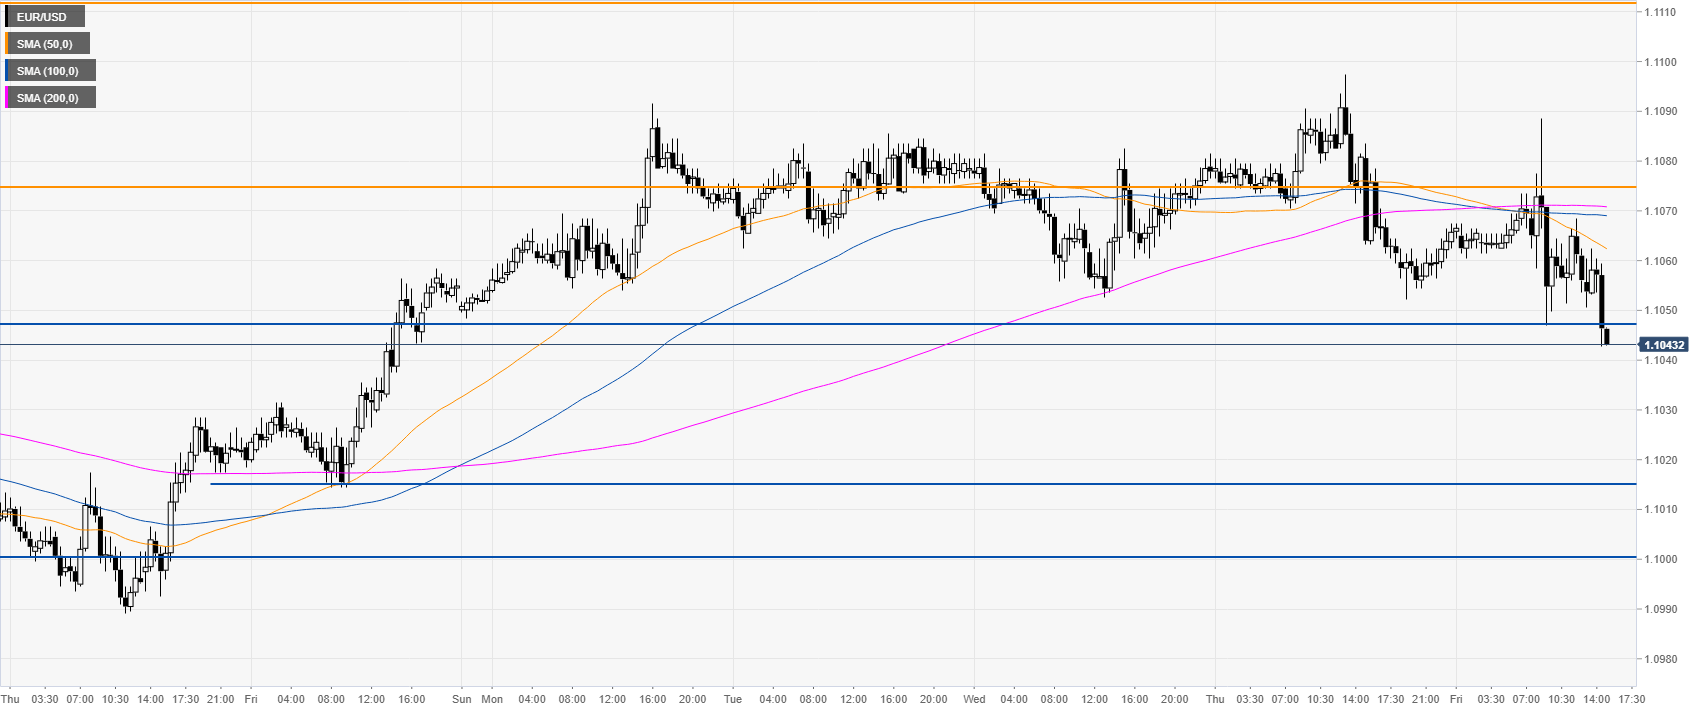
- EUR/USD is under pressure in the New York session.
- The market is challenging the 1.1047 support level.
- US Markit Manufacturing PMI in November (preliminary) improves to 52.2 vs. 51.5 expected.
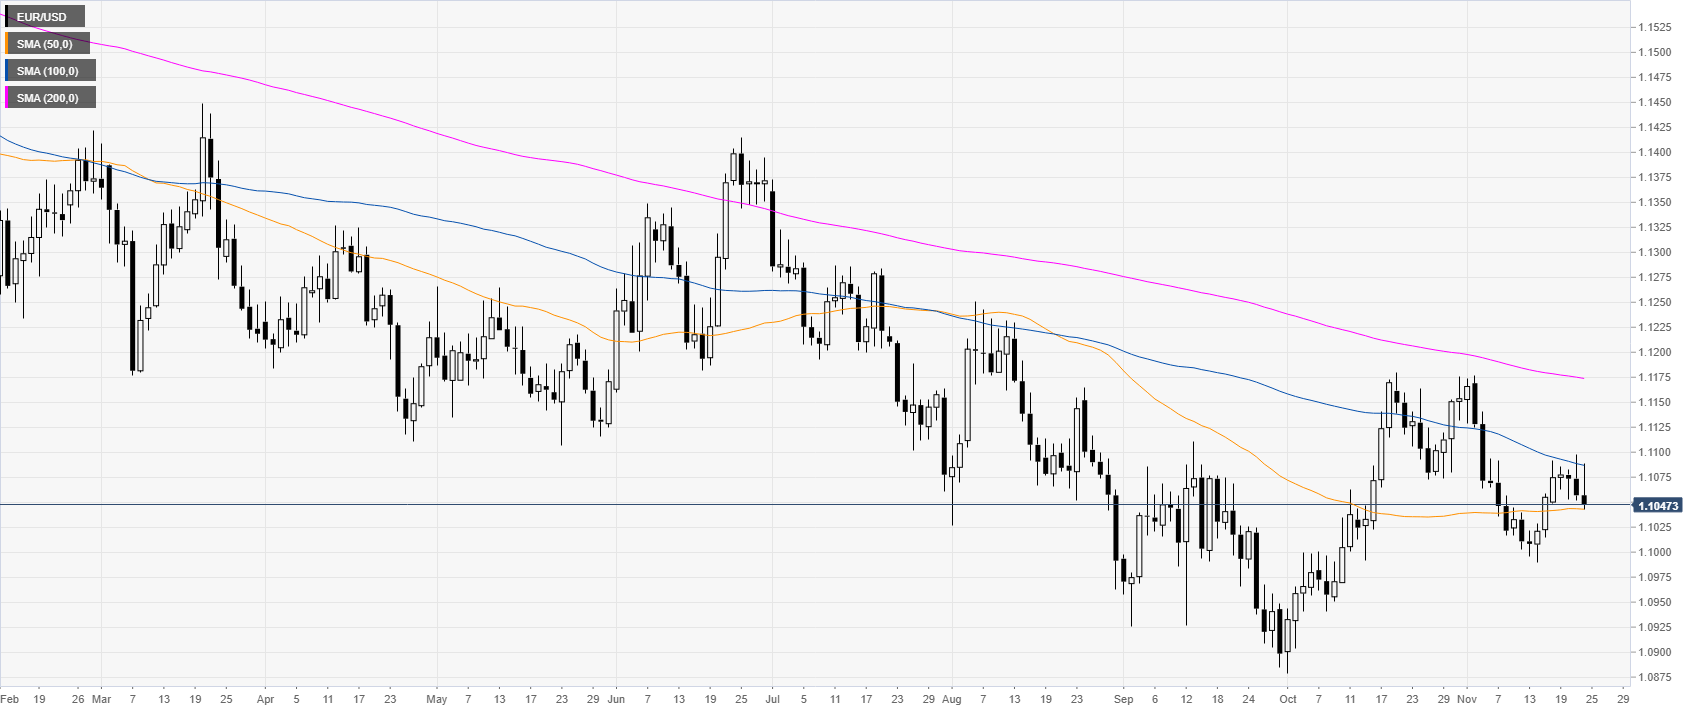
EUR/USD daily chart
EUR/USD, on the daily time frame, is trading in a bear trend below downward sloping 100 and 200-day simple moving averages (DMAs). This Friday, the market is trading at fresh weekly lows helped by the upbeat US data. US Markit Manufacturing PMI in November (preliminary) improves to 52.2 vs. 51.5 expected.
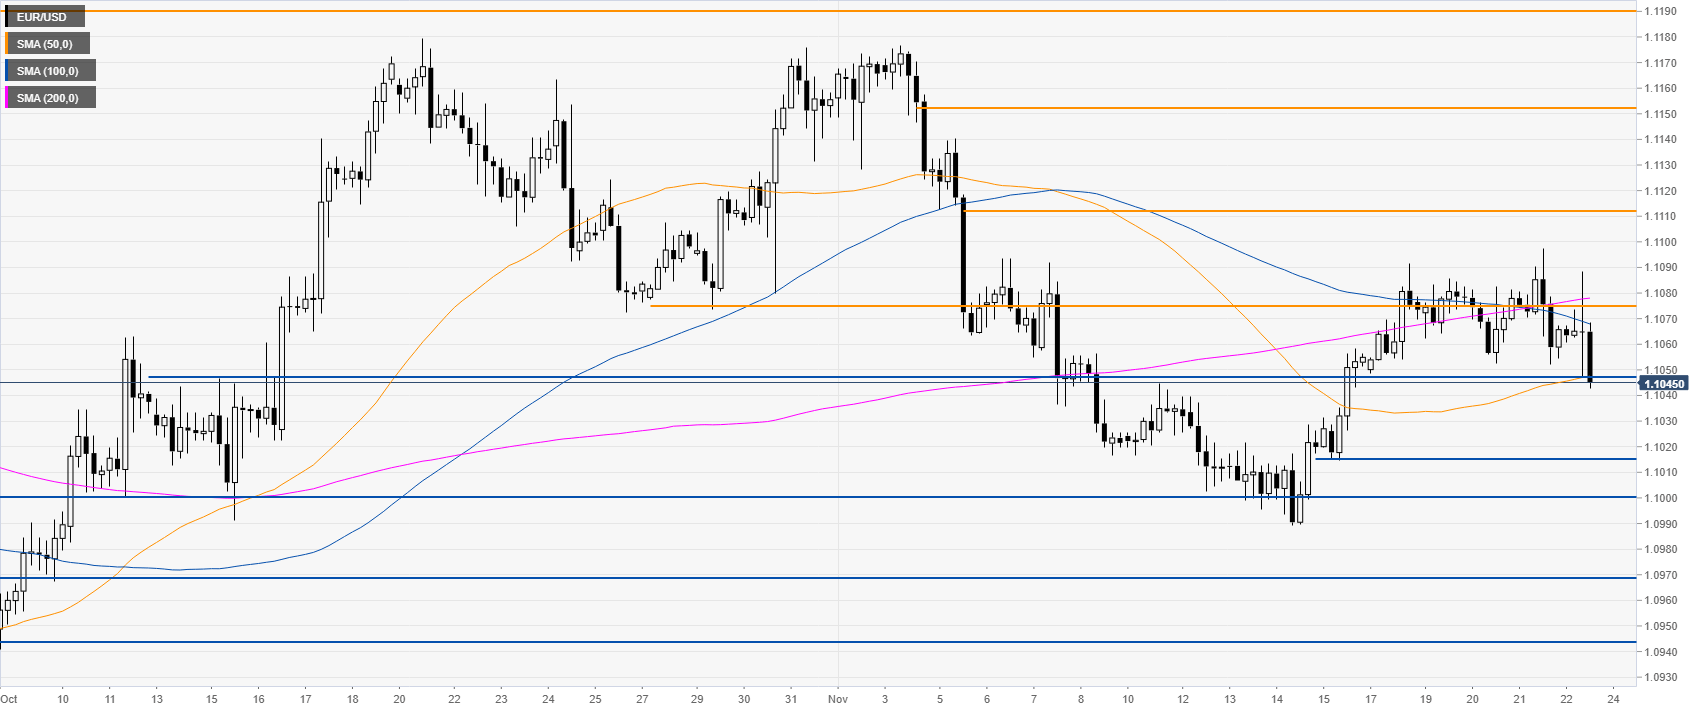
EUR/USD four-hour chart
The market is challenging the 1.1047 support level and the 50 SMA on the four-hour time frame. A daily close below the level would likely be a strong indication that bears are back in control. The decline could extend towards 1.1014/1.1000 zone followed by 1.0968 and 1.0945 price levels, according to the Technical Confluences Indicator.
EUR/USD 30-minute chart
The fiber is trading below the main SMAs, suggesting a bearish bias in the near term. The main resistances on the way up are the 1.1075 level followed by 1.1106 and the 1.1152 levels, according to the Technical Confluences Indicator. However, a breakout above the 1.1106 level on a daily basis could flip EUR/USD to bullish.
Additional key levels
