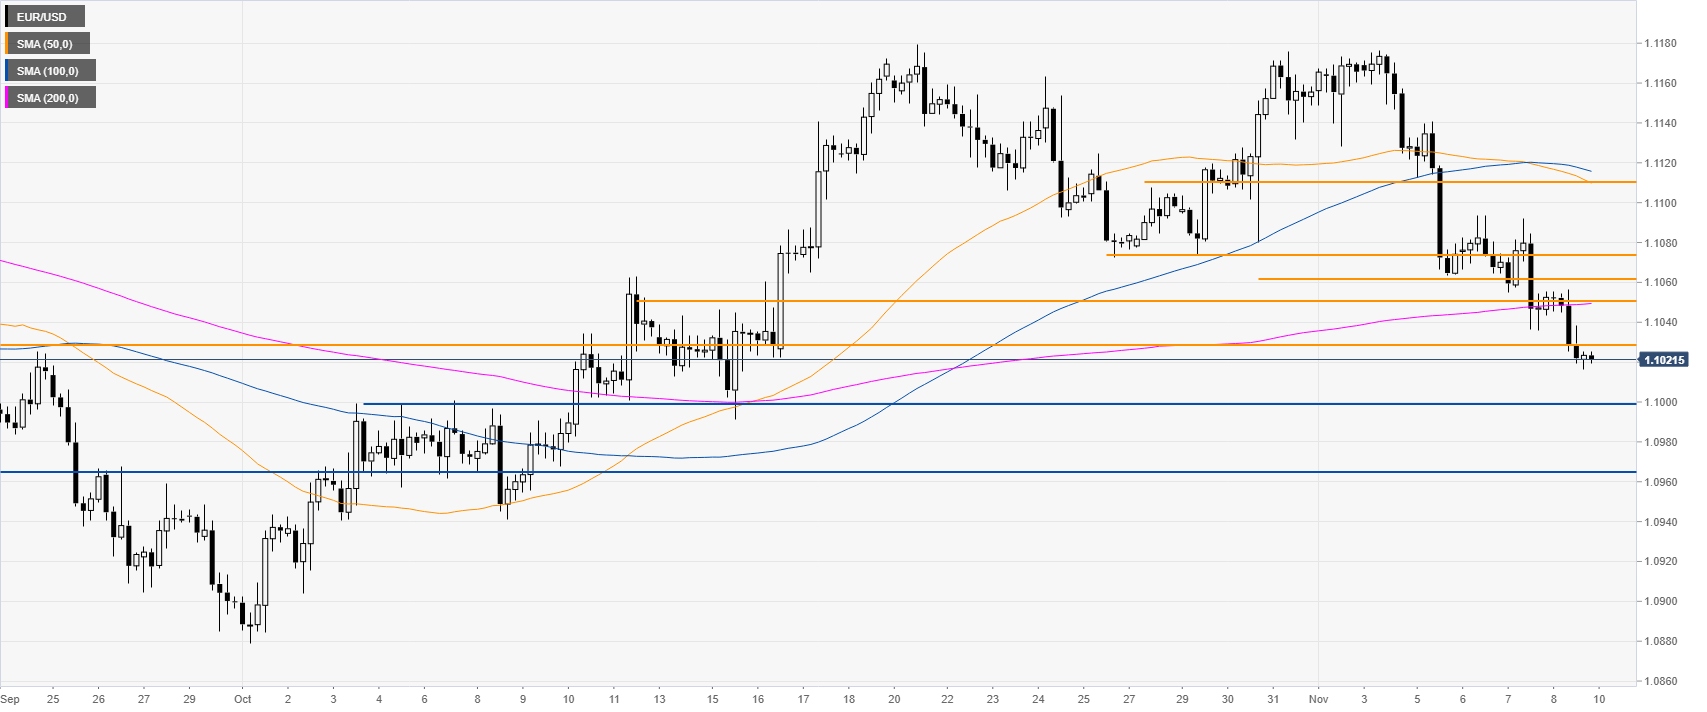
EUR/USD daily chart
The Euro, on the daily chart, is trading in a bear trend below its main daily simple moving averages (DMAs). The Fiber is registering its worst weekly decline since late August 2019.
EUR/USD four-hour chart
The Fiber is trading below its main SMAs on the four-hour chart suggesting a bearish bias in the medium term. Bears broke below the 1.1028 support level which is opening the way to further potential weakness towards the 1.1000 figure and to the 1.0965 price level steam, according to the Technical Confluences Indicator.
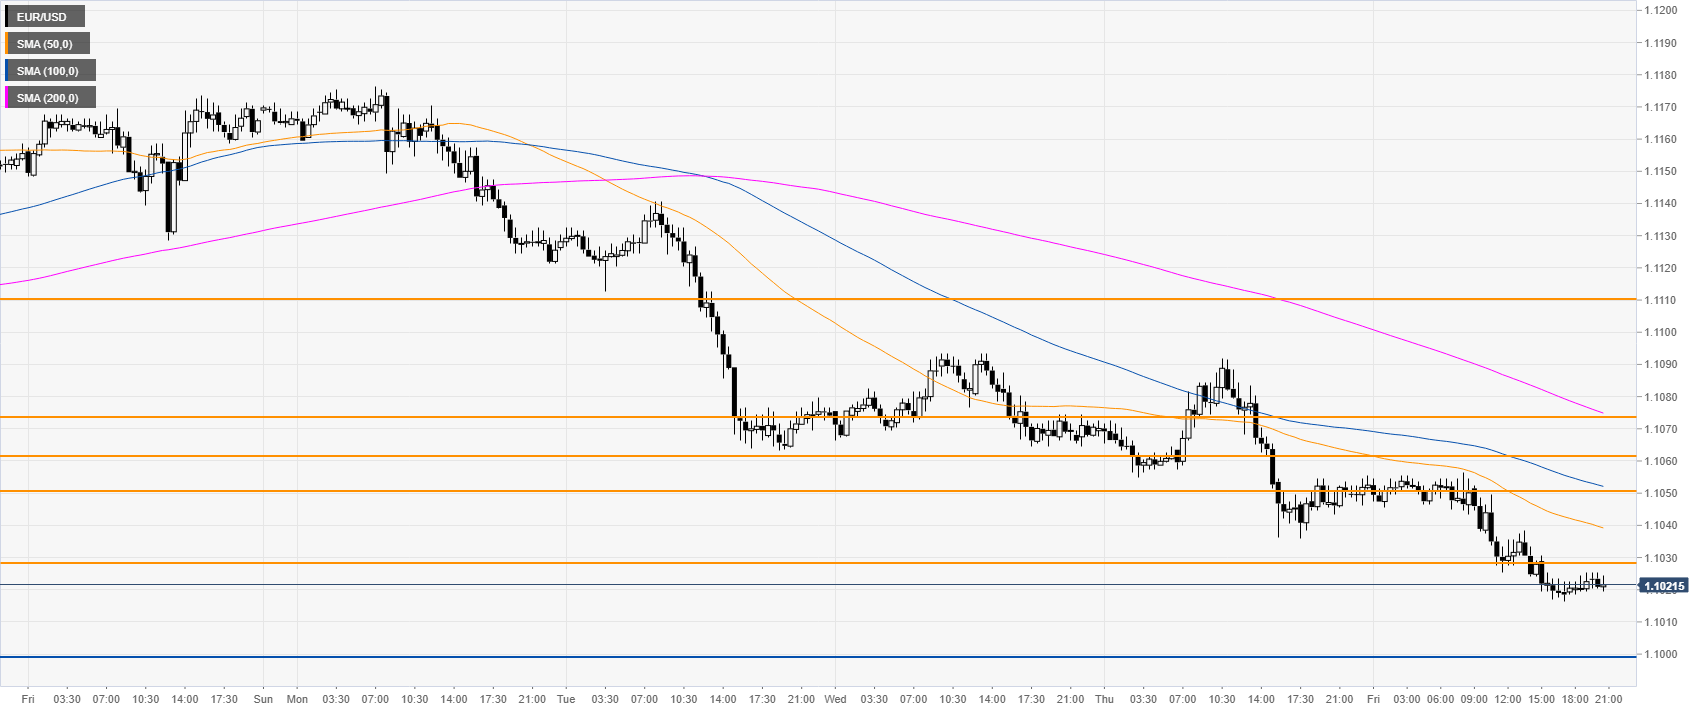
EUR/USD 30-minute chart
EUR/USD is under pressure below the main SMAs, suggesting a bearish bias in the near term. The 1.1028 and 1.1051 levels should act as resistance as well as the 1.1063/74 resistance zone, according to the Technical Confluences Indicator.
Additional key levels


