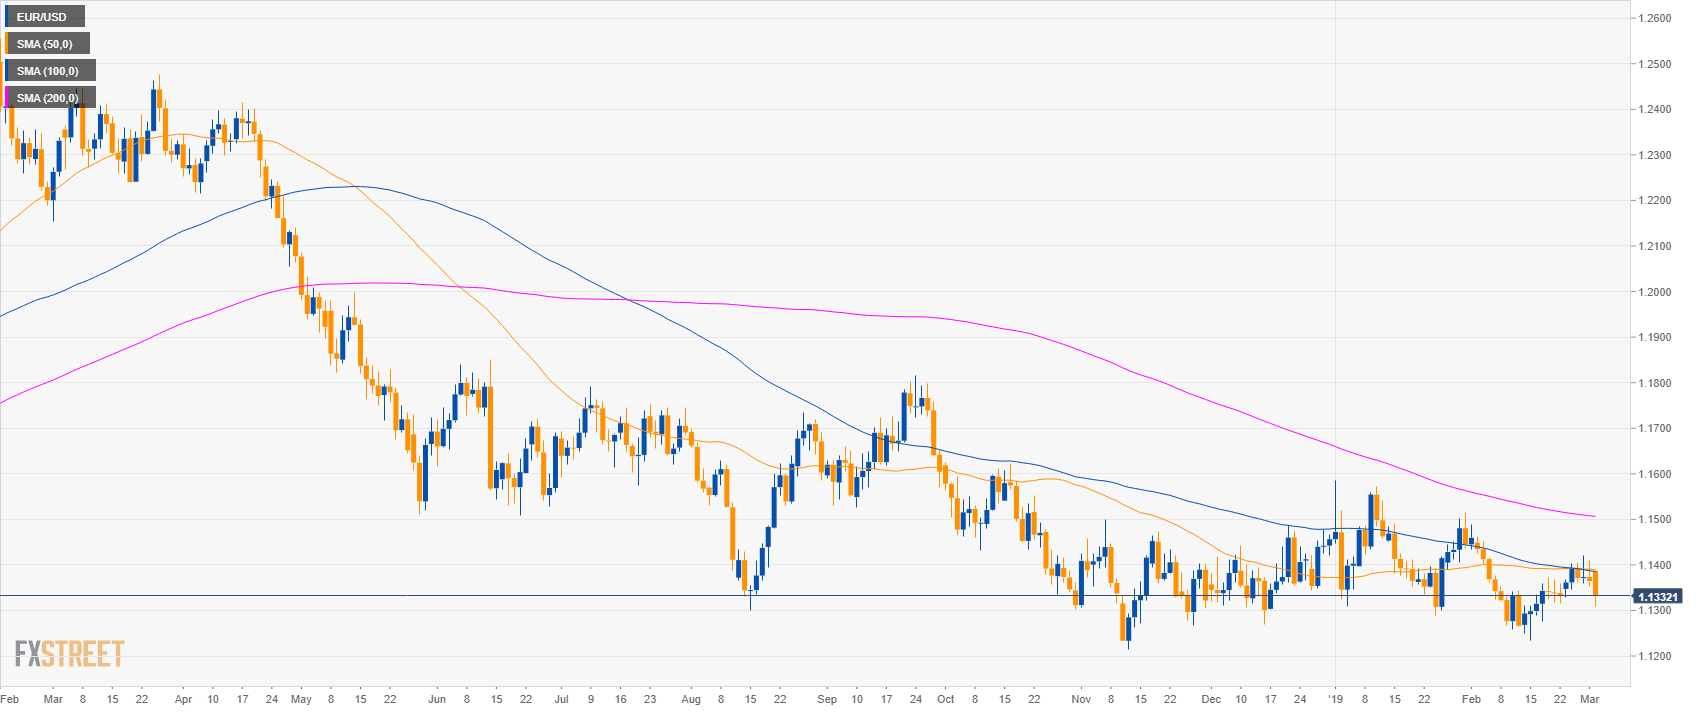
EUR/USD daily chart
- EUR/USD is trading in a bear trend below the 200-day simple moving averages (SMA).
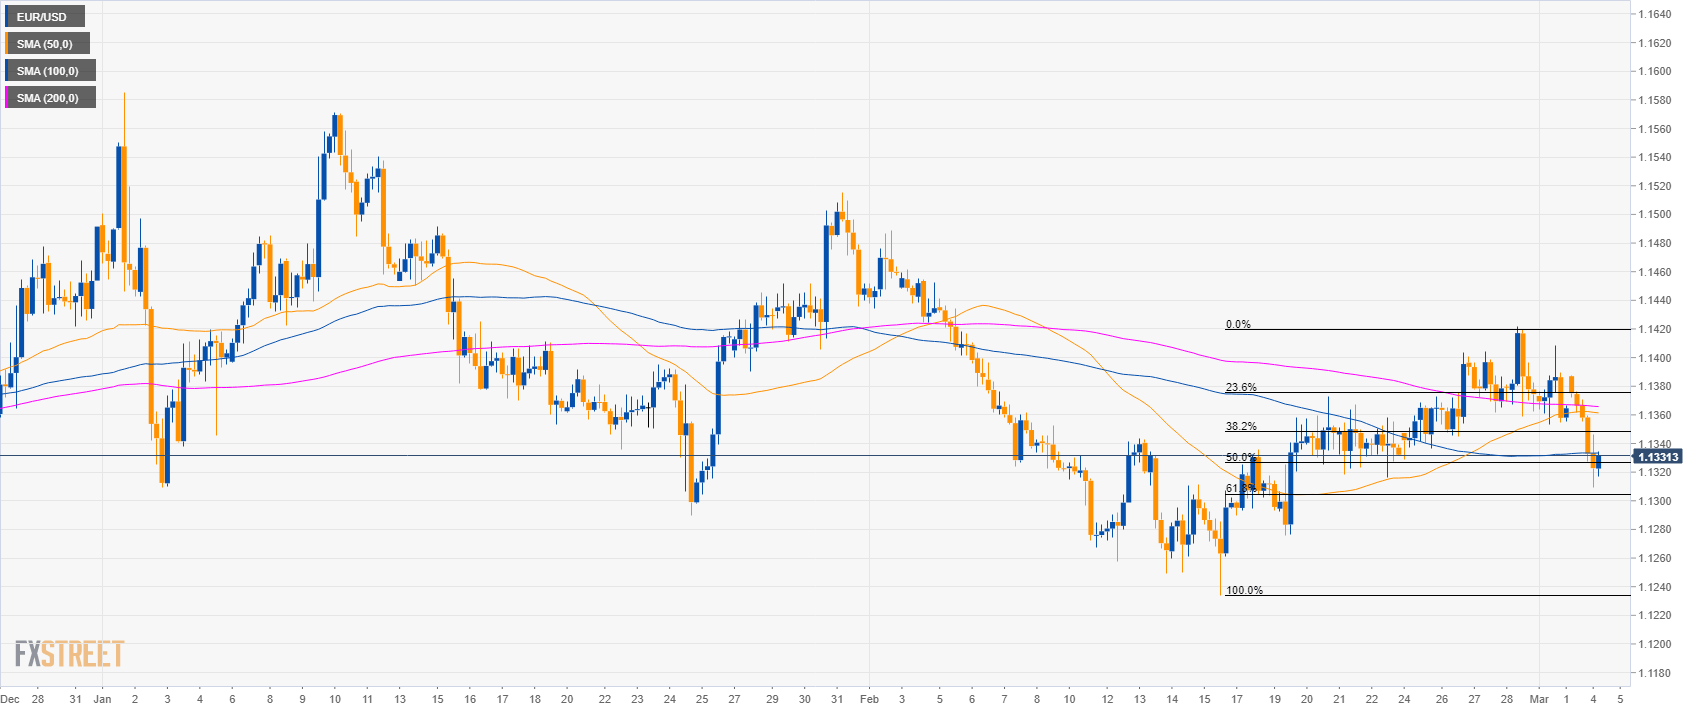
EUR/USD 4-hour chart
- EUR/USD retraced about 61.8% of its last bull move suggesting that bulls might find support here.
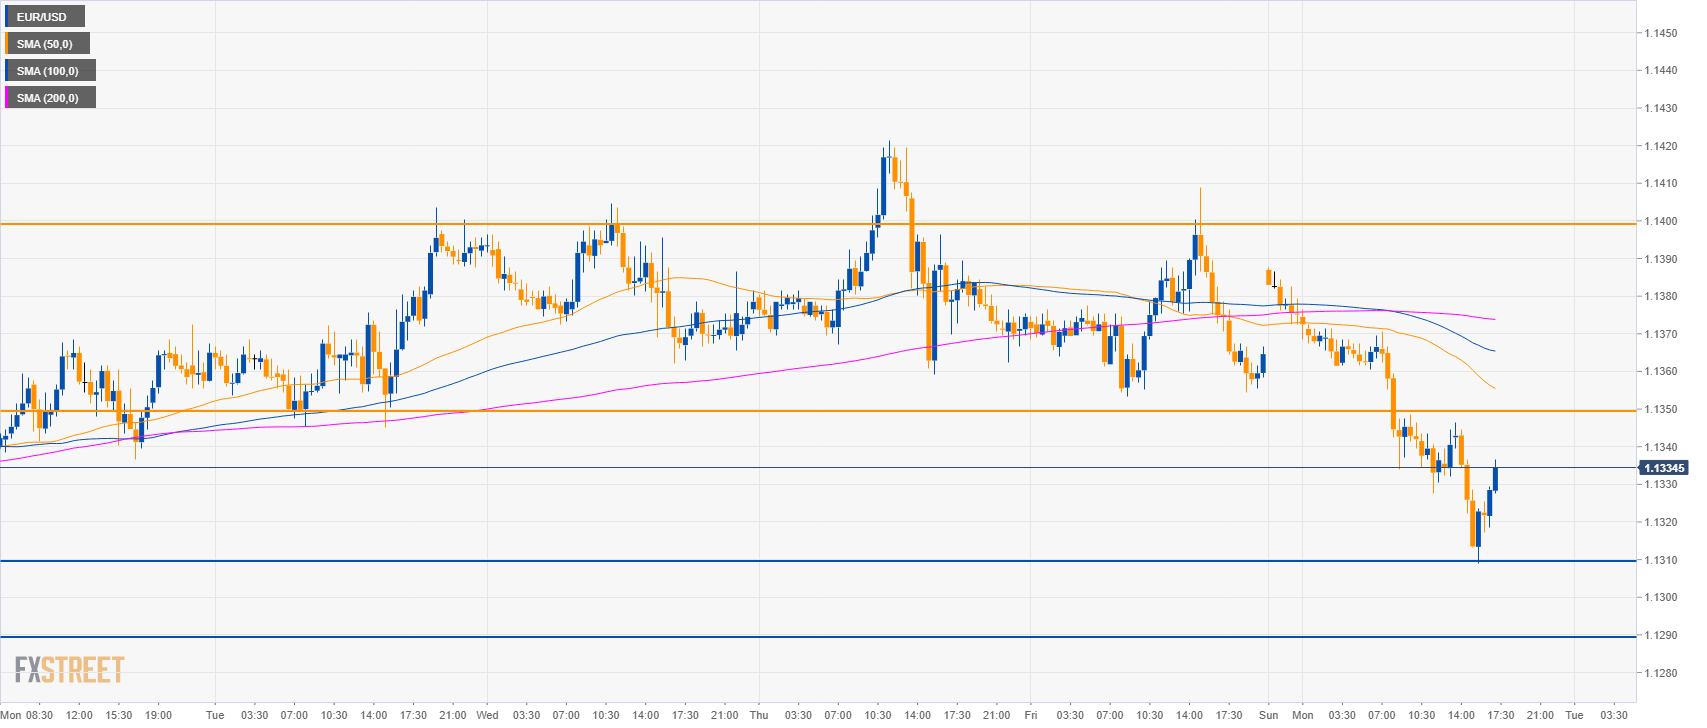
EUR/USD 30-minute chart
- EUR/USD is trading below its main SMAs suggesting that the momentum is still bearish.
- Bulls can target 1.1350 and potentially 1.1400 to the upside.
- Support is at 1.1310 and 1.1290 level.
Additional key levels
EUR/USD
Overview:
Today Last Price: 1.1332
Today Daily change: -33 pips
Today Daily change %: -0.29%
Today Daily Open: 1.1365
Trends:
Daily SMA20: 1.1344
Daily SMA50: 1.1391
Daily SMA100: 1.1387
Daily SMA200: 1.1508
Levels:
Previous Daily High: 1.1409
Previous Daily Low: 1.1353
Previous Weekly High: 1.1422
Previous Weekly Low: 1.1328
Previous Monthly High: 1.1489
Previous Monthly Low: 1.1234
Daily Fibonacci 38.2%: 1.1375
Daily Fibonacci 61.8%: 1.1388
Daily Pivot Point S1: 1.1342
Daily Pivot Point S2: 1.132
Daily Pivot Point S3: 1.1287
Daily Pivot Point R1: 1.1398
Daily Pivot Point R2: 1.1431
Daily Pivot Point R3: 1.1453
