- EUR/USD is ending Monday within familiar ranges.
- The key level to beat for bears is the 1.1016 support level.
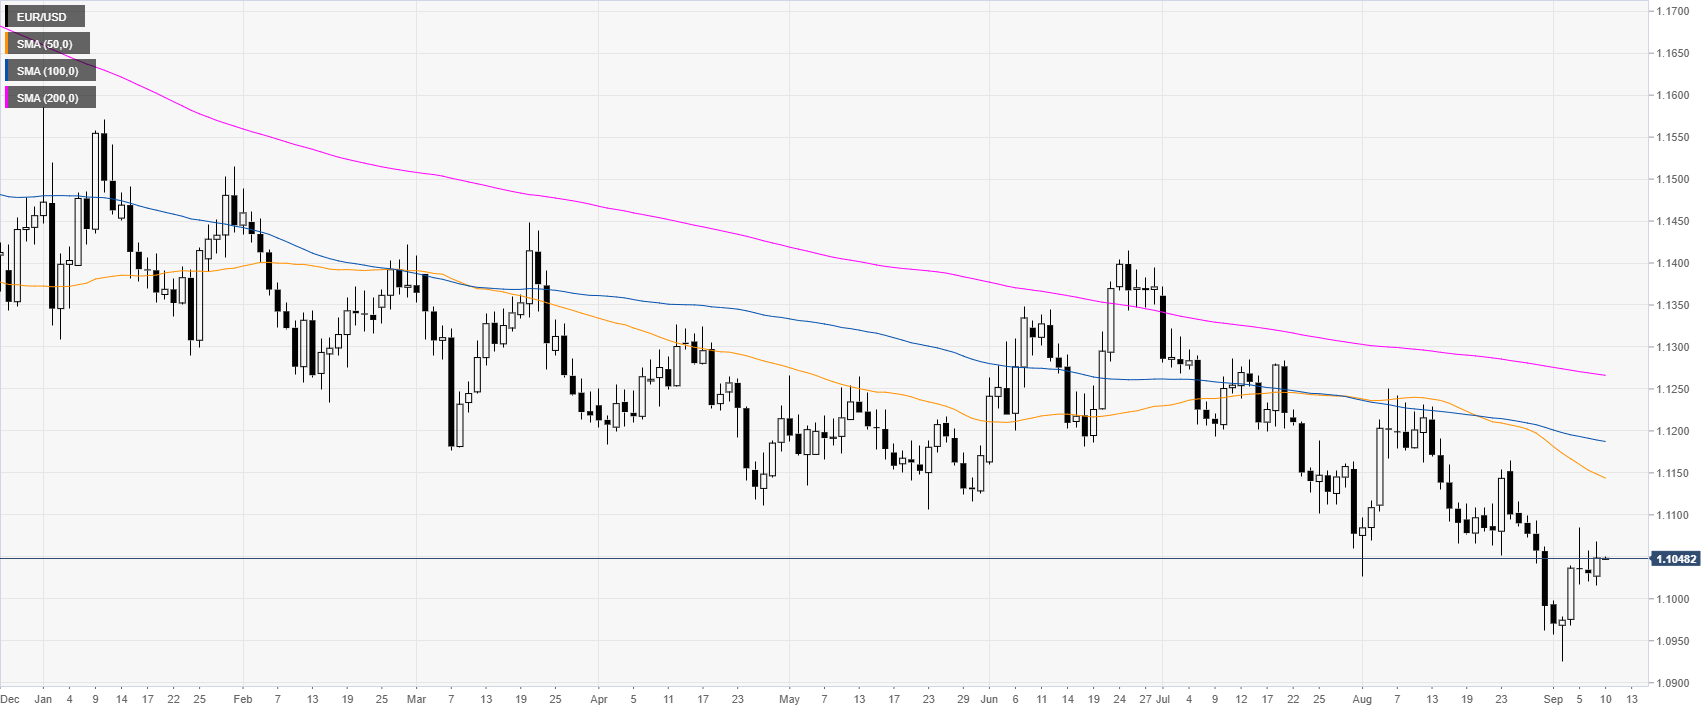
EUR/USD daily chart
On the daily time-frame, the single currency is trading in a bear trend below its main daily simple moving averages (DSMAs). The market has been consolidation for three days in a row.
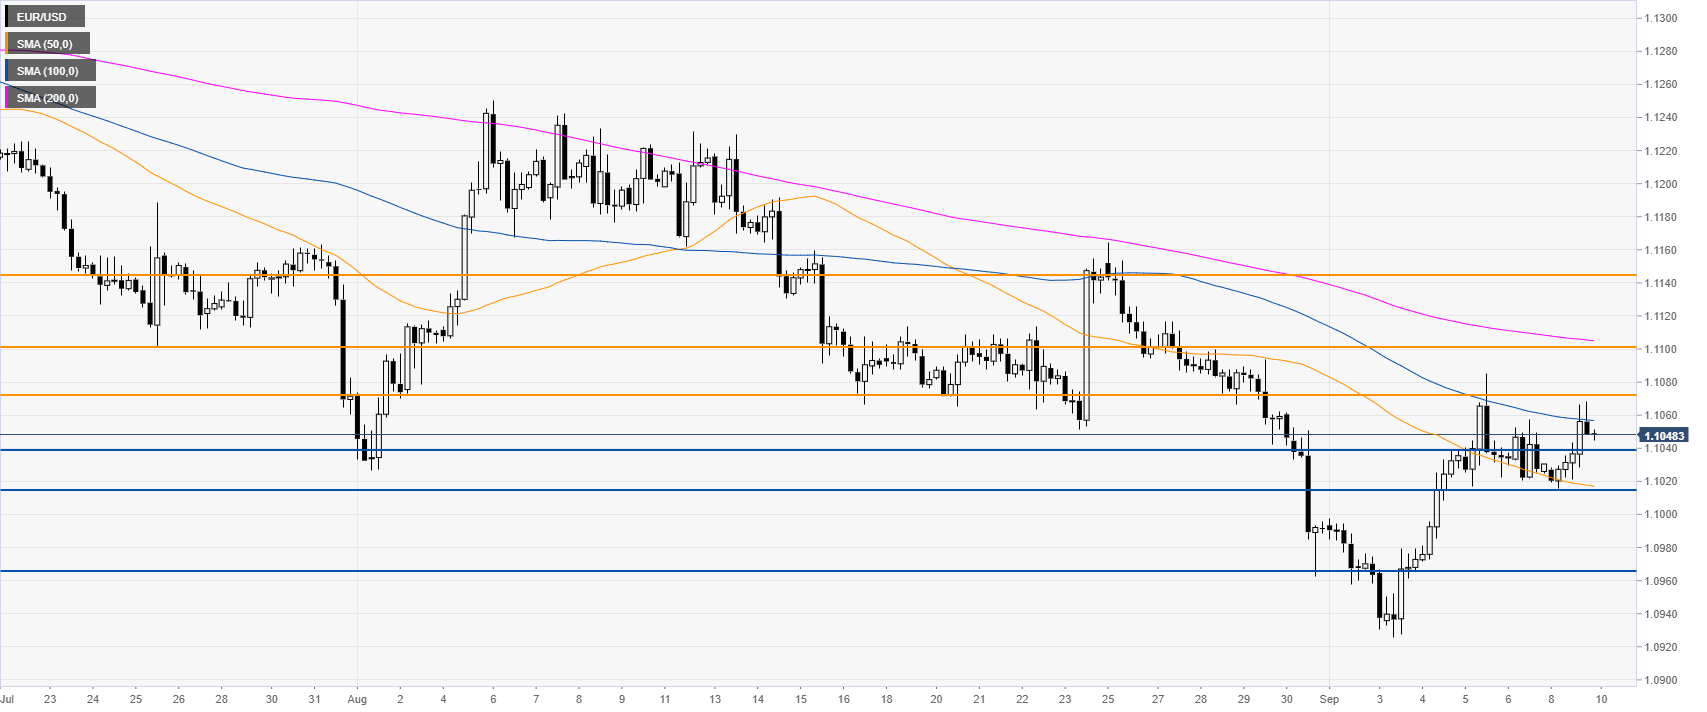
EUR/USD four-hour chart
EUR/USD challenged the 1.1073 resistance and the 100 SMA as the buyers took control this Monday. However, the spot would need to overcome the 1.1073/1.1100 resistance zone on a daily closing basis to confirm a bullish reversal en route towards 1.1142, according to the Technical Confluences Indicator.
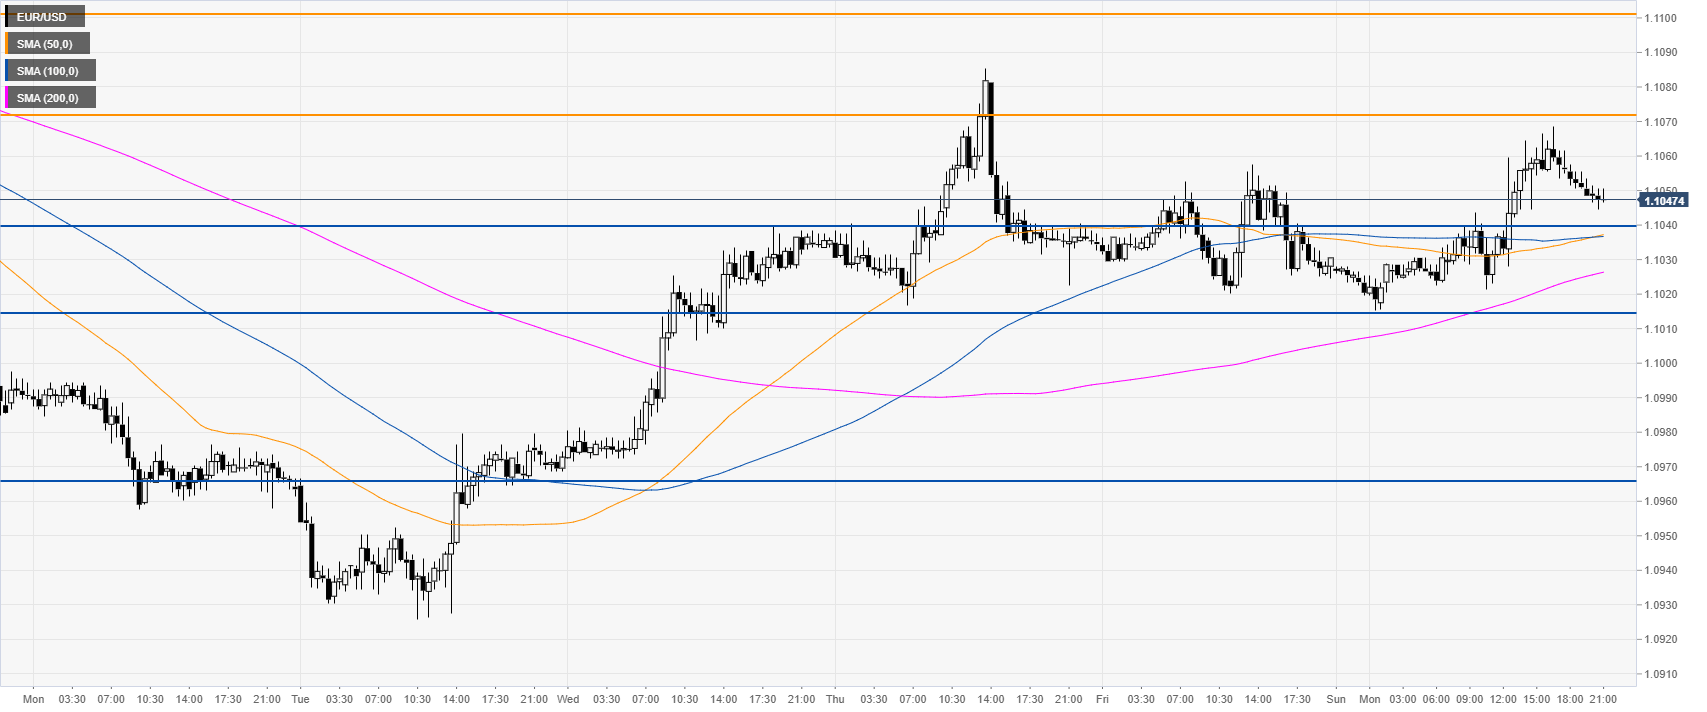
EUR/USD 30-minute chart
The Euro is trading within the range of the last two days. The market is trading above its main SMAs, suggesting bullish momentum in the short term. However, bulls will need a daily close above 1.1073 to attract further buying interest. On the other hand, a daily close below 1.1016 would be seen as bearish. Immediate support is at 1.1040 and 1.1016. Further down lies the 1.0965 price level.
Additional key levels
