- EUR/USD is ending Wednesday’s New York session keeping the consolidation theme unchanged.
- The level to beat for sellers is the 1.1043 level.
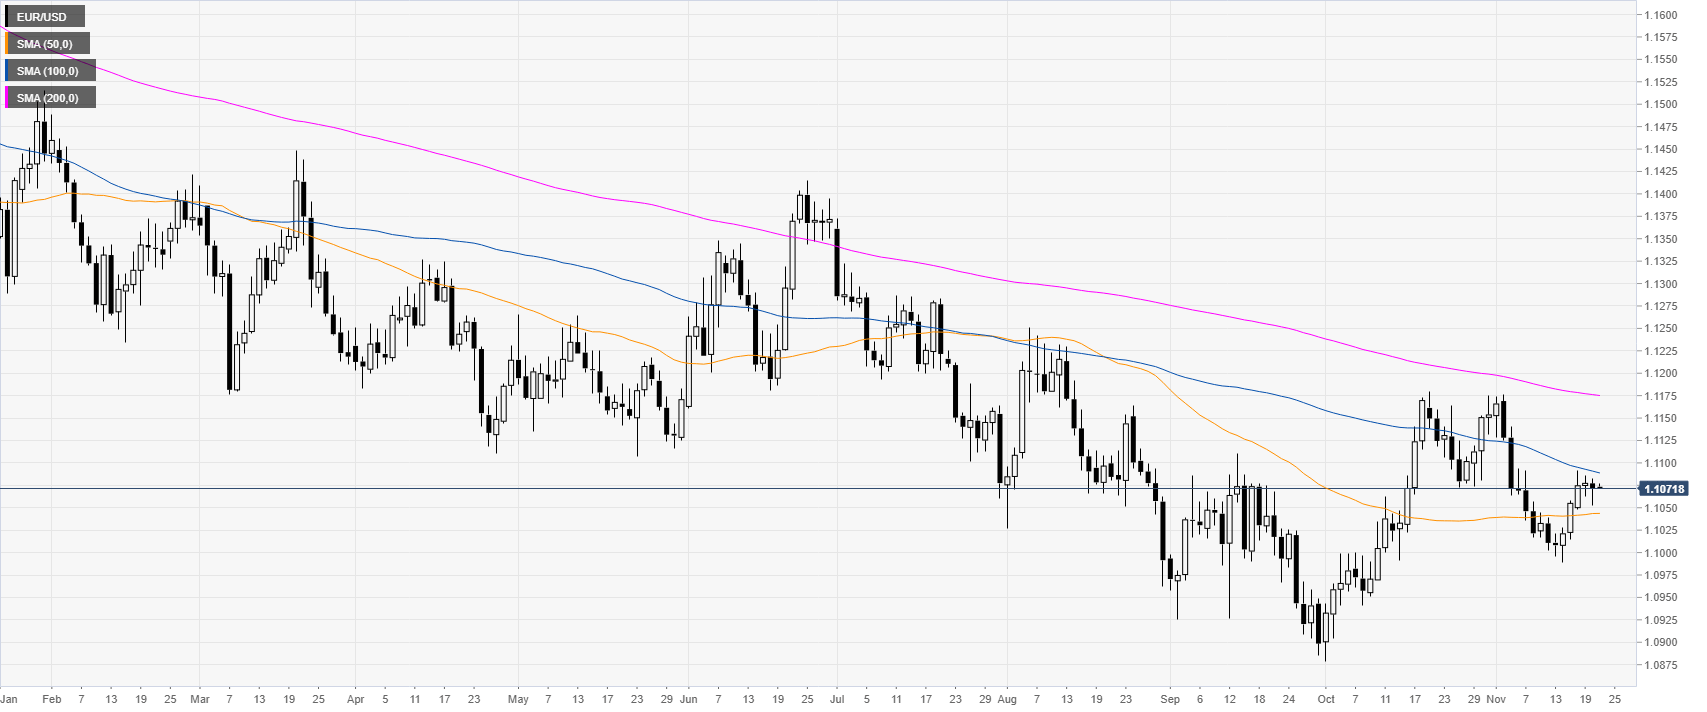
EUR/USD daily chart
The Fiber, on the daily chart, is trading in a downtrend below the downward sloping 100 and 200-day simple moving averages (DMAs). The FOMC minutes on Wednesday had little to no impact on the US Dollar.
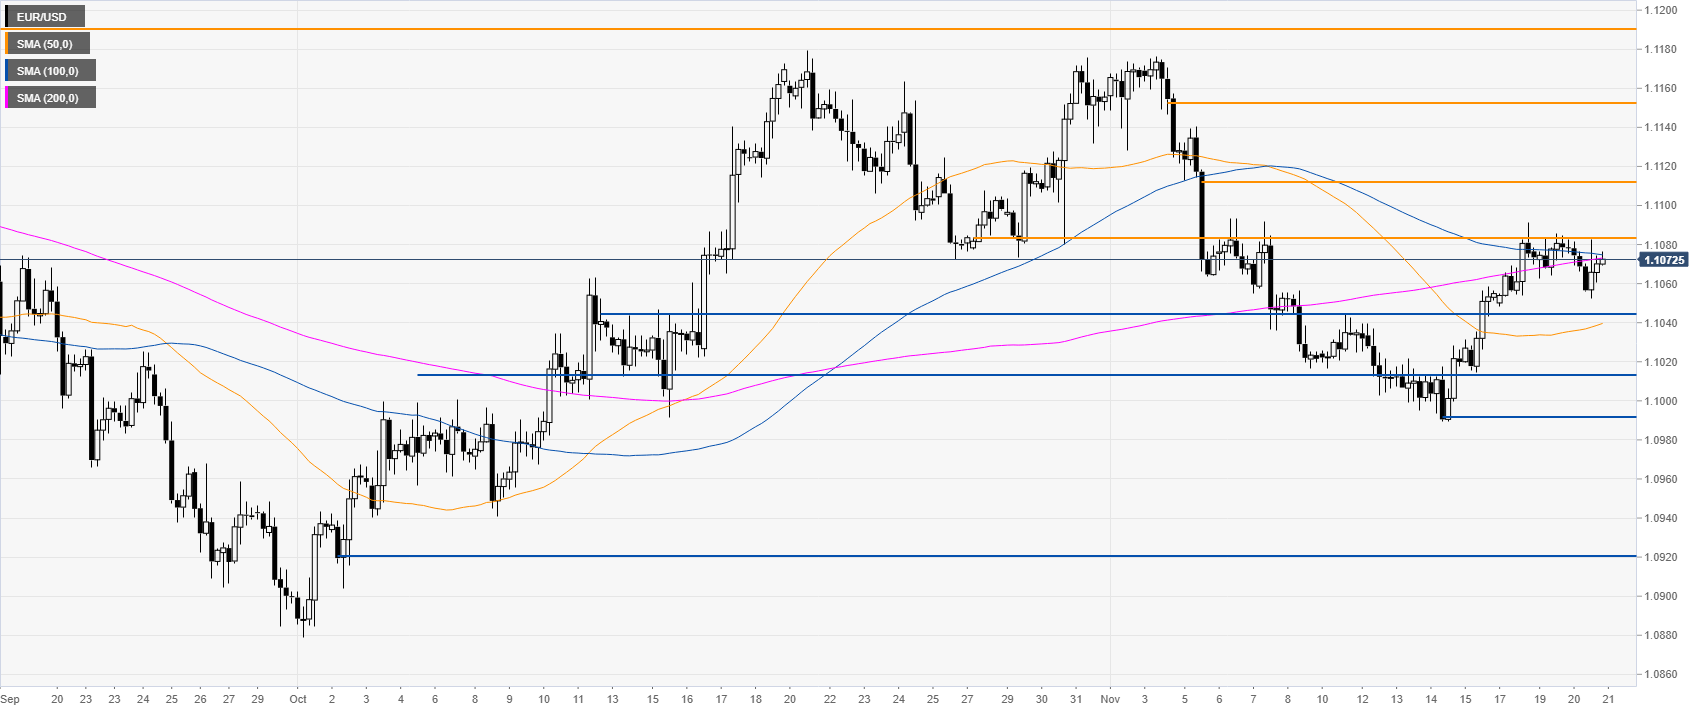
EUR/USD four-hour chart
The spot is currently capped below the 1.1083 resistance and the 100/200 SMAs. If the bears manage to keep the market below the 1.1083 resistance, a break below 1.1043 can lead to the 1.1014 and 1.0991 levels, according to the Technical Confluences Indicator.
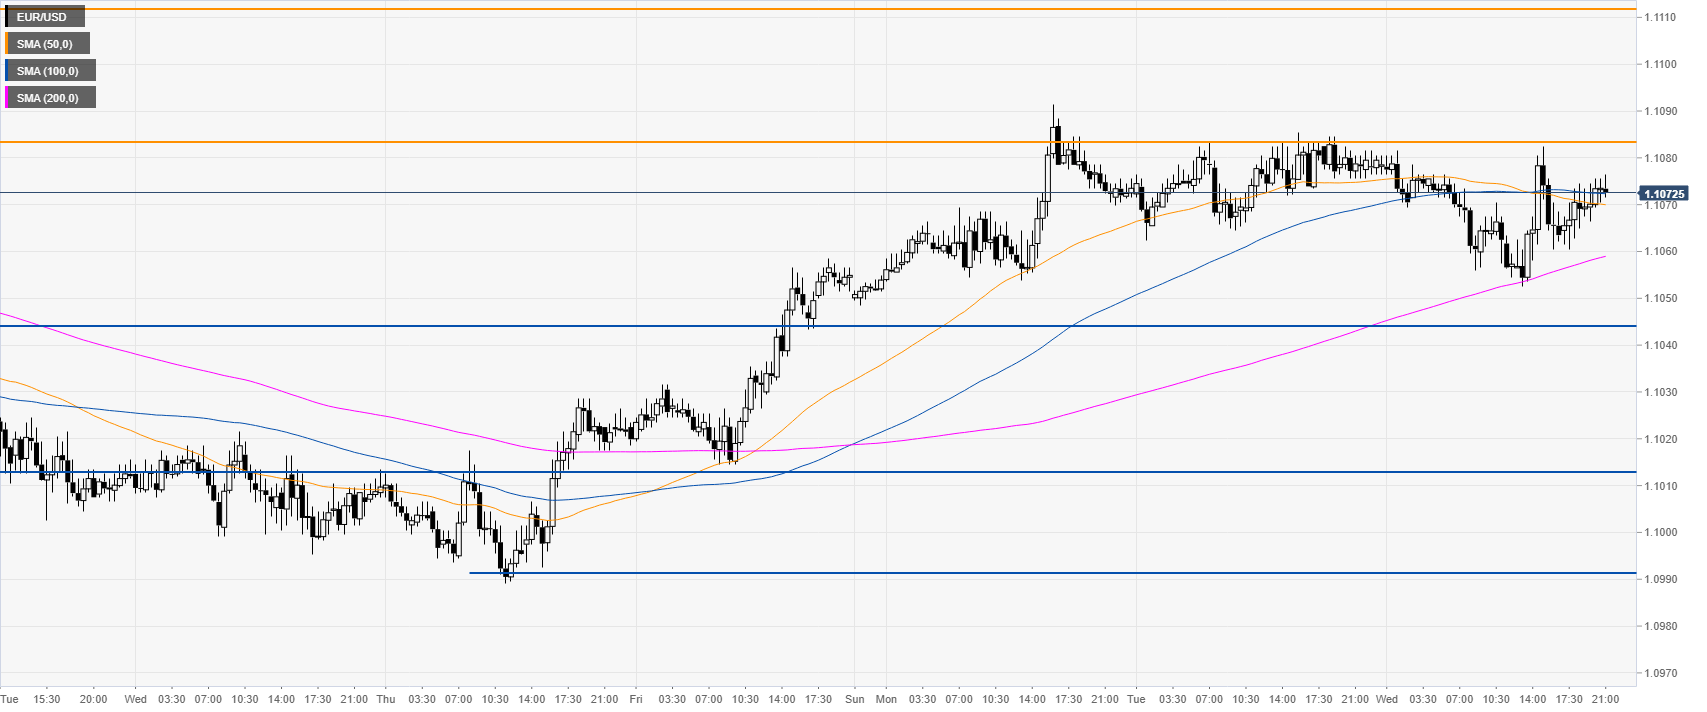
EUR/USD 30-minute chart
EUR/USD is trading in a narrow range for the third consecutive day, while above the 200 SMA. The critical resistance is seen at 1.1083. If the market closes above the level on a daily basis, it can lead to further gains towards the 1.1112 and 1.1152 resistances.
Additional key levels
