- EUR/USD broke below a significant support at 1.1200 figure.
- Bears will be looking at the 1.1147 and 1.1101 to the downside according to the Technical Confluences Indicator.
- Mario Draghi the President of the European Central Bank said that he leaves the door open to further stimulus including rate cuts.
- Earlier the ZEW survey and the inflation data in Europe disappointed adding to the poor mood on the EUR.
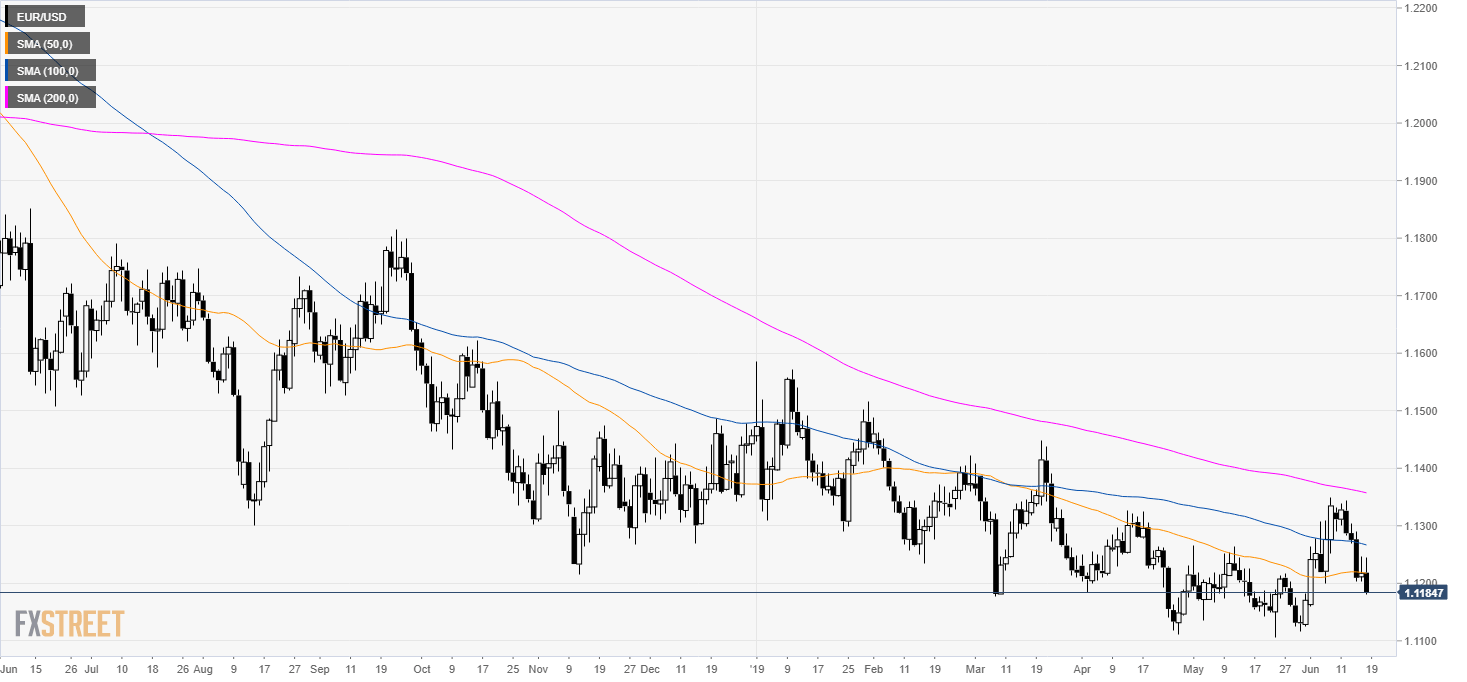
EUR/USD daily chart
EUR/USD is in a bear trend below its main simple moving average (DSMA). The market is breaking below the 1.1200 figure.

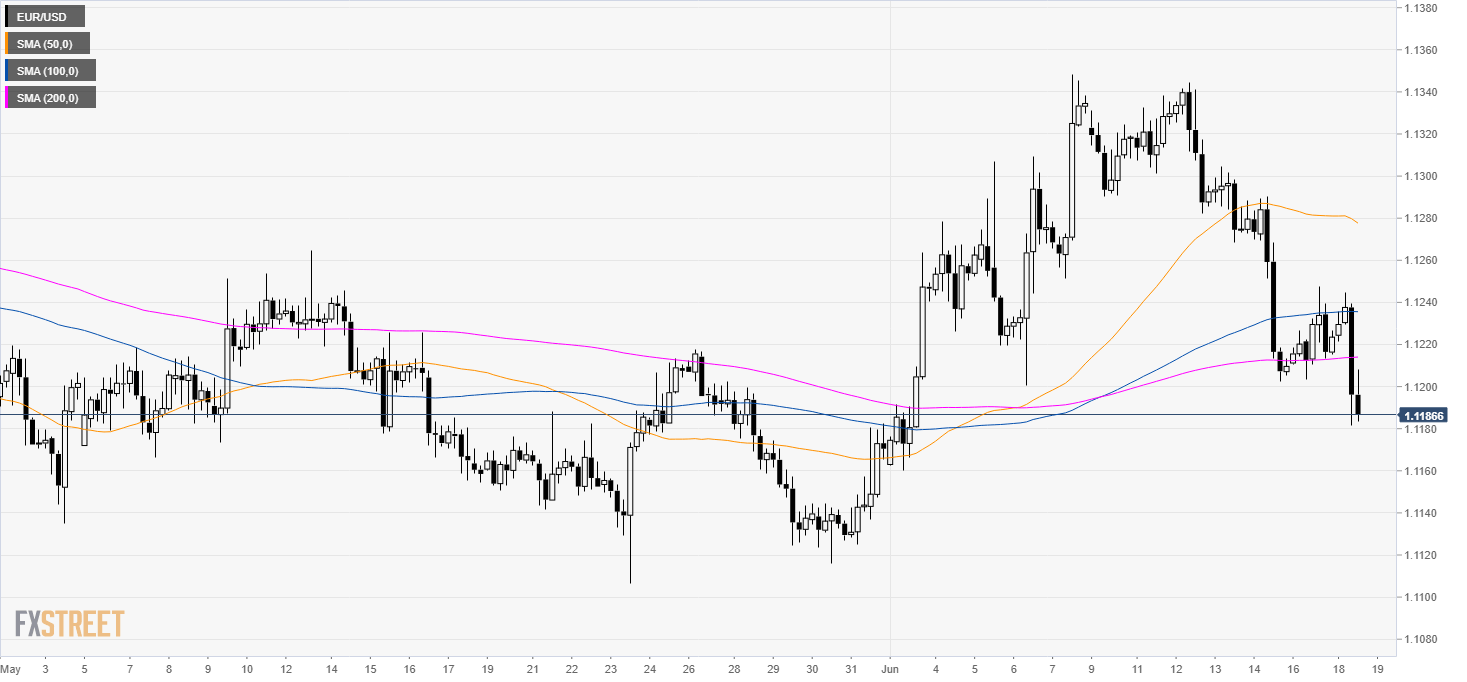
EUR/USD 4-hour chart
The market broke below the main SMAs suggesting a bearish bias in the near term. The market is currently testing 1.1180 support, which is the Pivot Point one-day S2 and the lower Bollinger Band on the 4-hour chart according to the Technical Confluences Indicator.
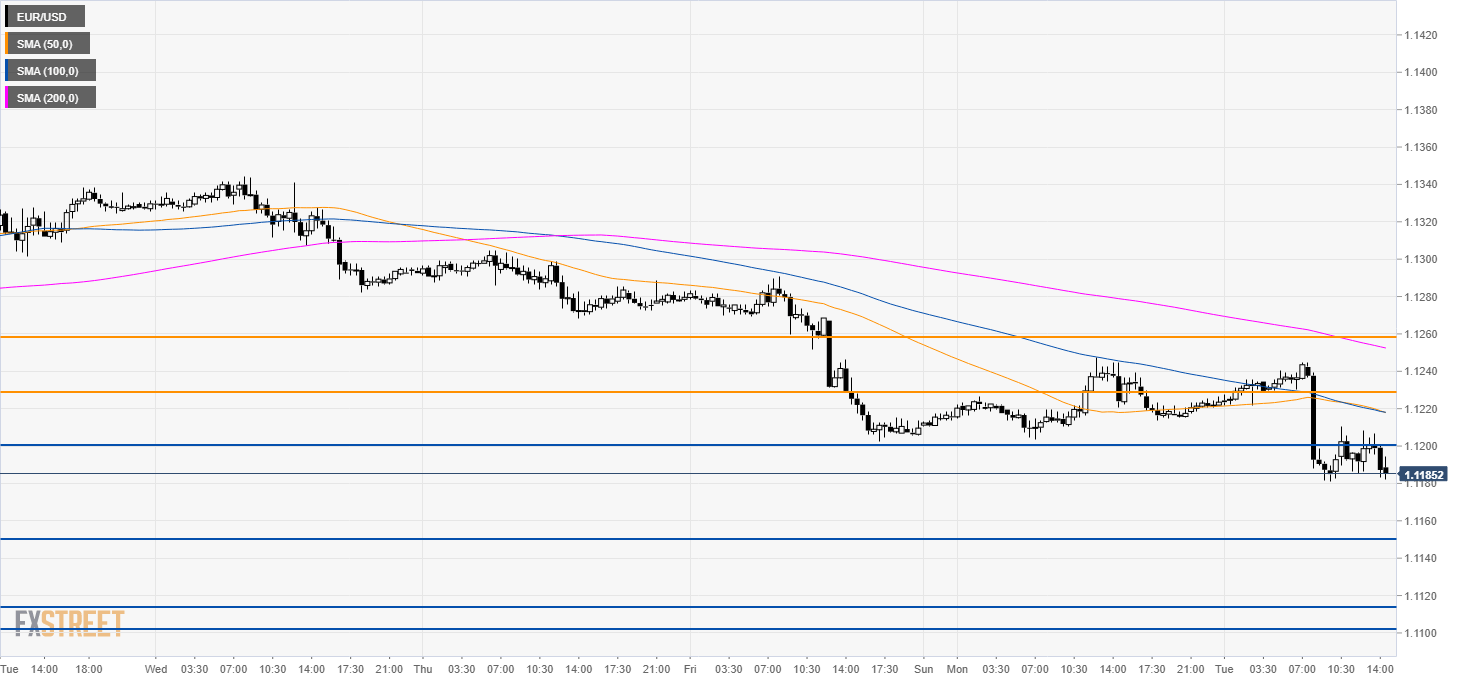
EUR/USD 30-minute chart
EUR/USD is under pressure below its main SMAs. A break below 1.1180 can lead to 1.1147 the monthly Fibonacci of 23.6% after that comes the 1.1112 support (previous month low and Pivot Point 1 week S2 closely followed by 1.1101, the monthly Pivot Point S1 and the lower Bolling Band on the daily chart.
Additional key levels