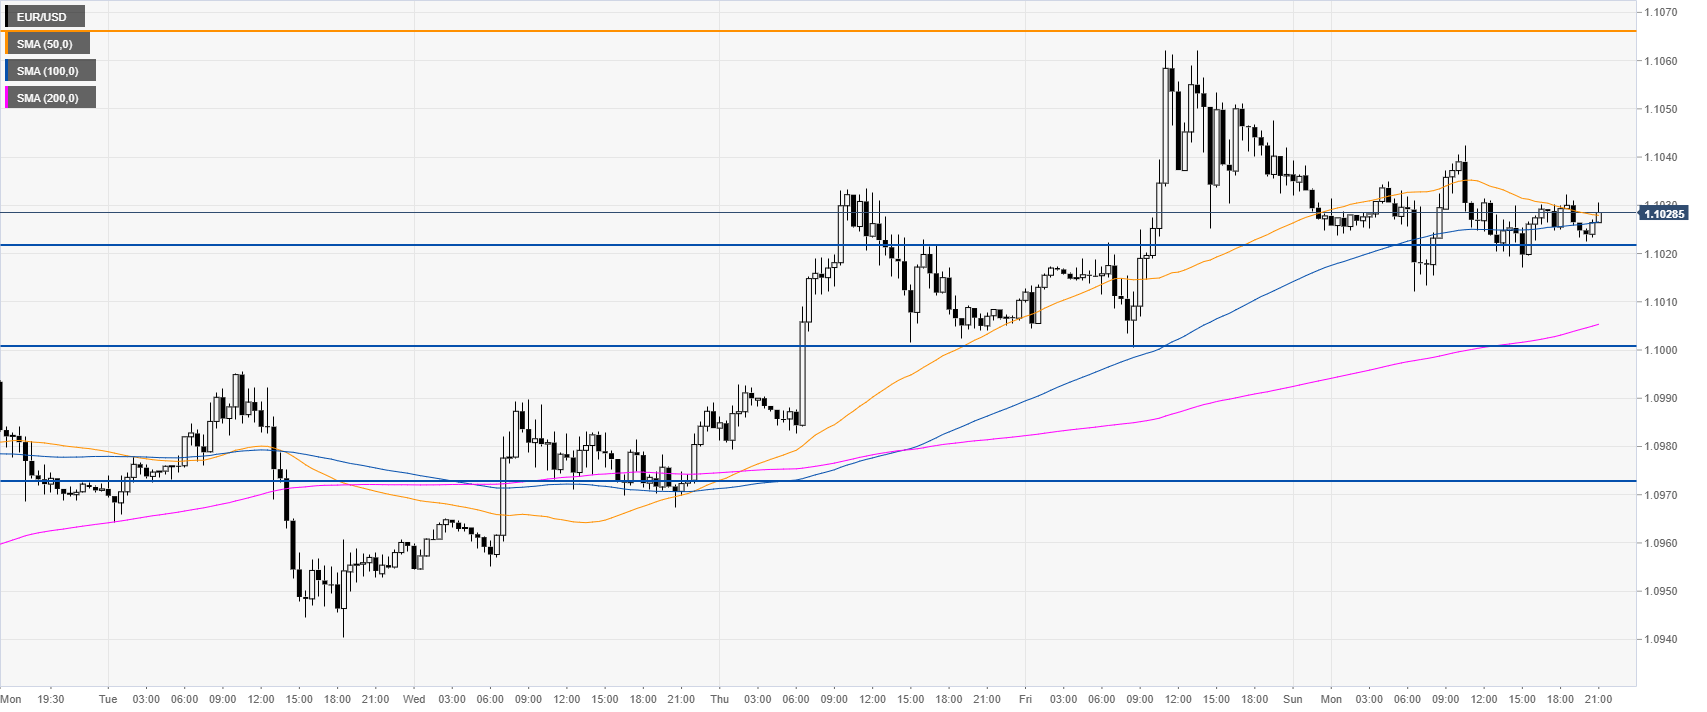
- Colombus Day on Monday yields limited volatility on the EUR/USD.
- Monday’s trading ends virtually unchanged with the Fiber still hanging above the 1.1000 figure.
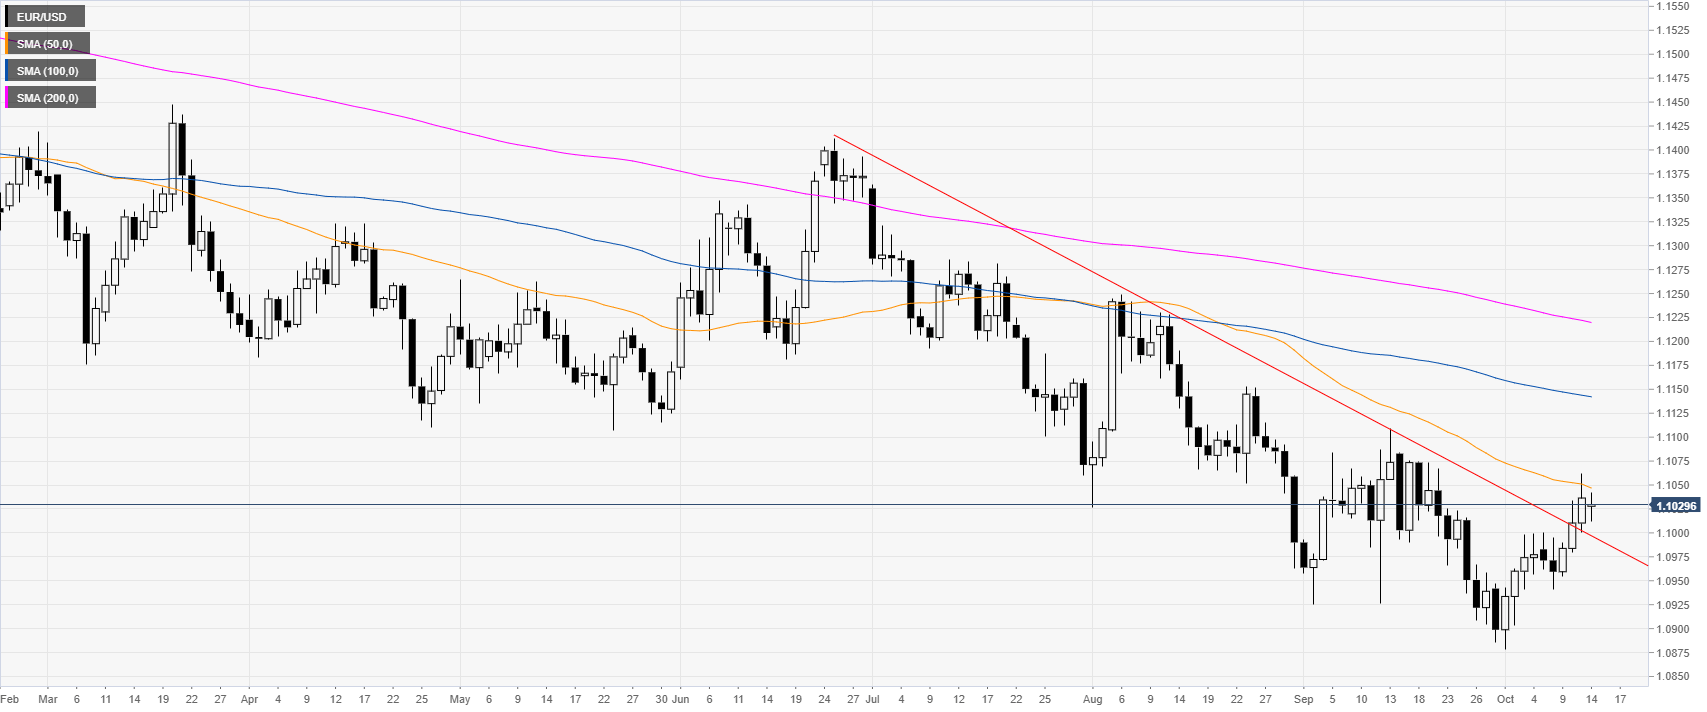
EUR/USD daily chart
On the daily chart, the shared currency is trading in a bear trend below its 100 and 200-day simple moving averages (DSMAs). However, last week, the Fiber broke above a multi-week trendline and tested the 50 SMA. This Monday, the spot consolidated last week’s gains below the 50 SMA.
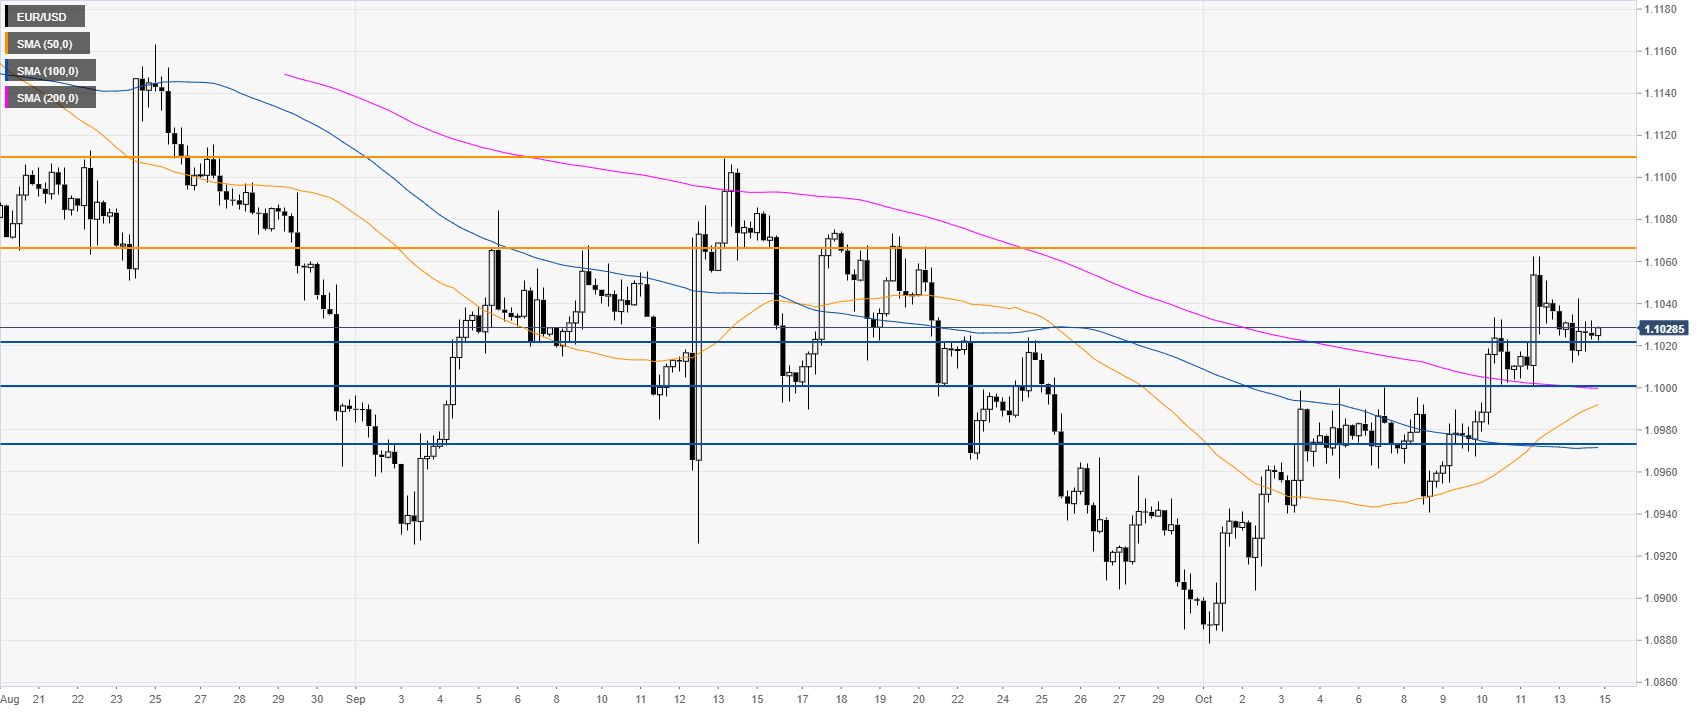
EUR/USD four-hour chart
The Euro is trading above the main SMAs, suggesting bullish momentum in the medium term. EUR/USD is consolidating last week’s advance above the 1.1000/1.1020 support zone and the 200 SMA. The 1.1067 level is the level to beat for bulls if they intend to reach the 1.1090 resistance on the way up, according to the Technical Confluences Indicator.
EUR/USD 30-minute chart
The Fiber is ending Monday virtually unchanged. A daily close below the 1.1000 handle could switch the bias to bearish in the short and medium term.
Additional key levels
