- EUR/USD is advancing and challenging the 1.0960 resistance after the London close.
- The level to beat for buyers is the 1.0960 resistance followed by 1.0985 level.
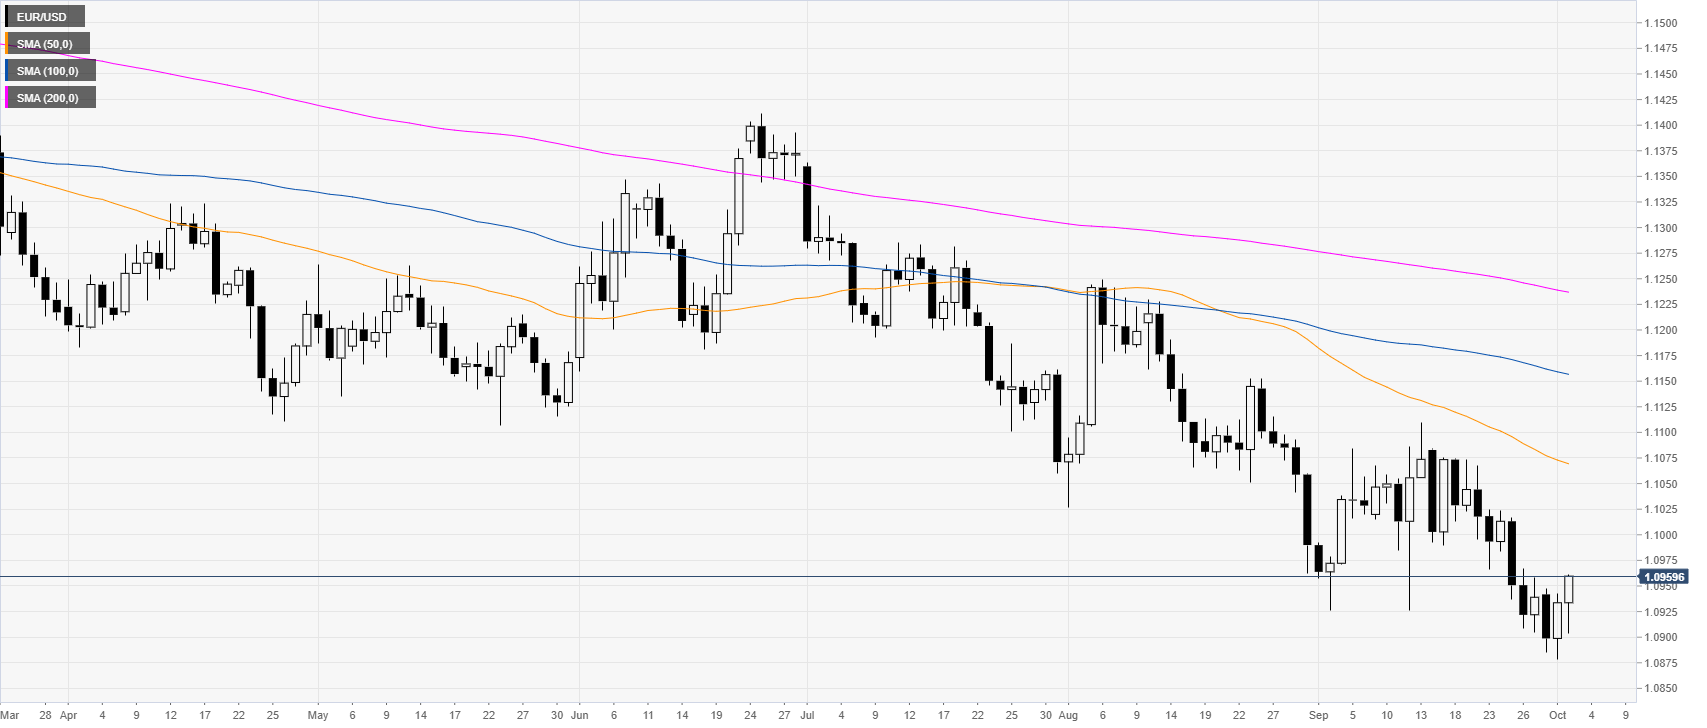
EUR/USD daily chart
The shared currency, on the daily chart, is trading in a bear trend below the main daily simple moving averages (DSMAs). This Wednesday, the ADP, the forerunner of the Nonfarm Payrolls on Friday disappointed with only 135k vs. 140k expected in September. Back on Tuesday, the worst reading in 10 years of the ISM Manufacturing PMI sparked negative sentiment around the Greenback and the general market.
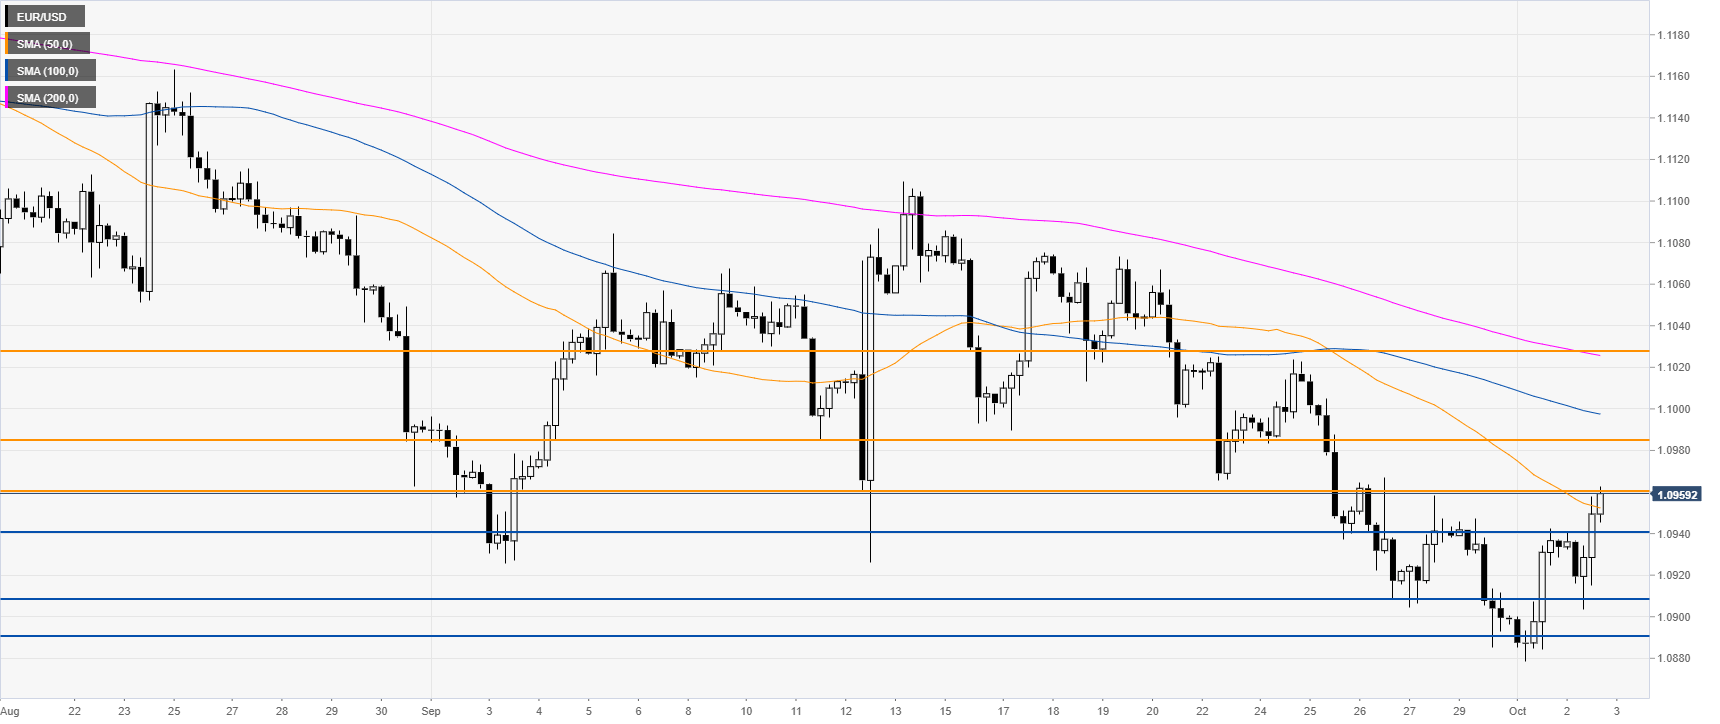
EUR/USD four-hour chart
EUR/USD is challenging the 1.0960 resistance while trading above the 50 SMA, suggesting a correction up in the medium term. A break above the 1.0960 level can expose the 1.0985 resistance, according to the Technical Confluences Indicator. Further up lies the 1.1030 resistance level.
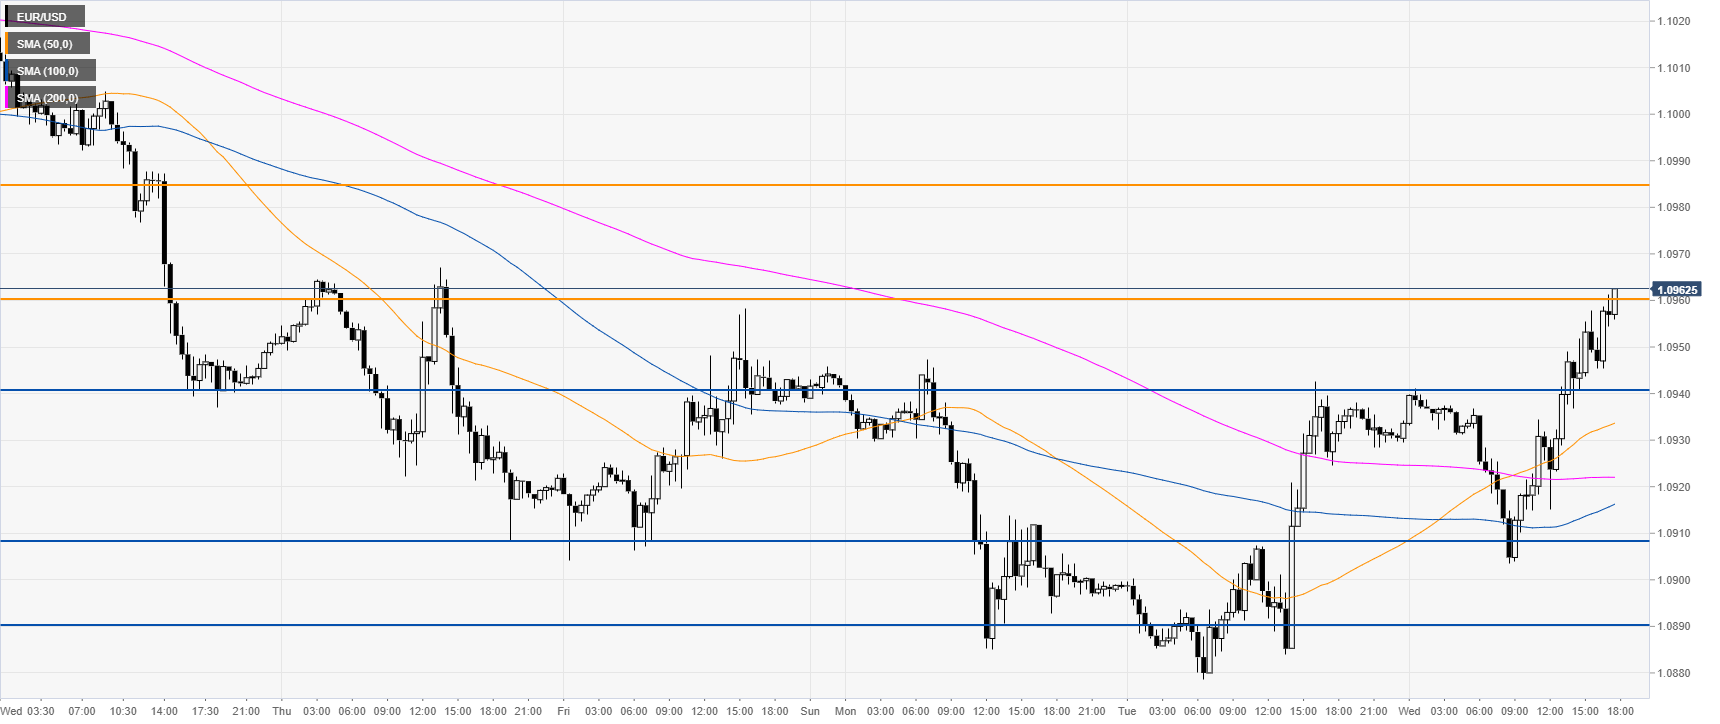
EUR/USD 30-minute chart
EUR/USD is trading above its main SMAs, suggesting bullish momentum in the near term. Immediate support is seen at the 1.0940 and 1.0908 levels, according to the Technical Confluences Indicator.
Additional key levels
