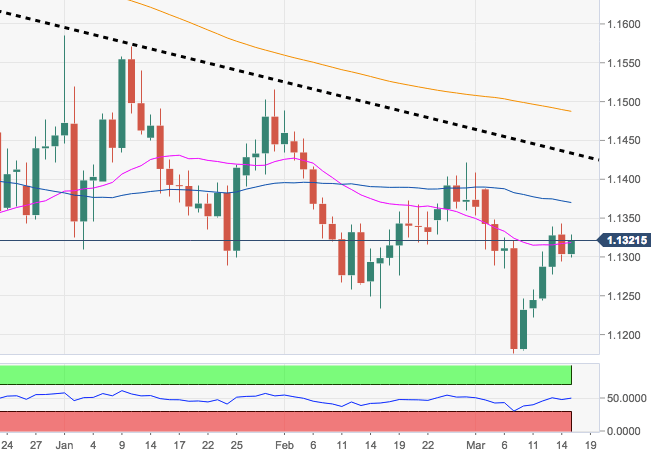
- The pair looks consolidative in the upper end of the weekly range and is flirting with the critical resistance area around 1.1330, where emerges the key 200-week SMA.
- The pair needs to clear this hurdle to allow for a potential visit to the 1.1370 zone, coincident with the 55-day and 100-day SMAs.
- On the broader picture, a test of YTD lows in the 1.1180/75 band remains on the cards as long as the multi-month resistance line – today at 1.1432 – caps the upside.
EUR/USD daily chart
EUR/USD
Overview:
Today Last Price: 1.1327
Today Daily change: 32 pips
Today Daily change %: 0.20%
Today Daily Open: 1.1304
Trends:
Daily SMA20: 1.1318
Daily SMA50: 1.1367
Daily SMA100: 1.137
Daily SMA200: 1.149
Levels:
Previous Daily High: 1.1342
Previous Daily Low: 1.1294
Previous Weekly High: 1.1388
Previous Weekly Low: 1.1176
Previous Monthly High: 1.1489
Previous Monthly Low: 1.1234
Daily Fibonacci 38.2%: 1.1313
Daily Fibonacci 61.8%: 1.1324
Daily Pivot Point S1: 1.1284
Daily Pivot Point S2: 1.1265
Daily Pivot Point S3: 1.1236
Daily Pivot Point R1: 1.1333
Daily Pivot Point R2: 1.1362
Daily Pivot Point R3: 1.1381
