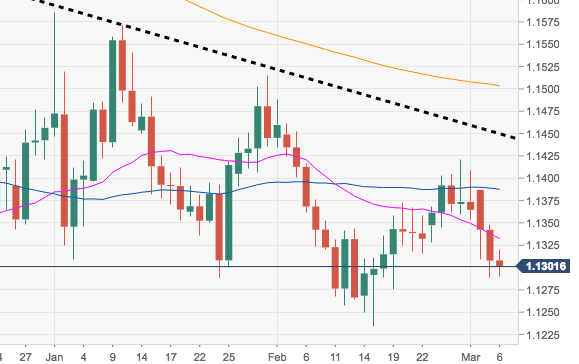
- EUR/USD comes under extra selling pressure around the 1.1300 neighbourhood today, opening the door for the continuation of the leg lower in the short-term horizon.
- Further south lies the YTD lows at 1.1234 ahead of the 2018 low at 1.1216 recorded in late November.
- The pair’s outlook is expected to remain on the negative side as long as the 5-month support line at 1.1449 caps the upside.
EUR/USD daily chart
EUR/USD
Overview:
Today Last Price: 1.1302
Today Daily change: 21 pips
Today Daily change %: -0.05%
Today Daily Open: 1.1308
Trends:
Daily SMA20: 1.1334
Daily SMA50: 1.1388
Daily SMA100: 1.1382
Daily SMA200: 1.1505
Levels:
Previous Daily High: 1.1348
Previous Daily Low: 1.1289
Previous Weekly High: 1.1422
Previous Weekly Low: 1.1328
Previous Monthly High: 1.1489
Previous Monthly Low: 1.1234
Daily Fibonacci 38.2%: 1.1312
Daily Fibonacci 61.8%: 1.1326
Daily Pivot Point S1: 1.1282
Daily Pivot Point S2: 1.1256
Daily Pivot Point S3: 1.1223
Daily Pivot Point R1: 1.1341
Daily Pivot Point R2: 1.1374
Daily Pivot Point R3: 1.14
