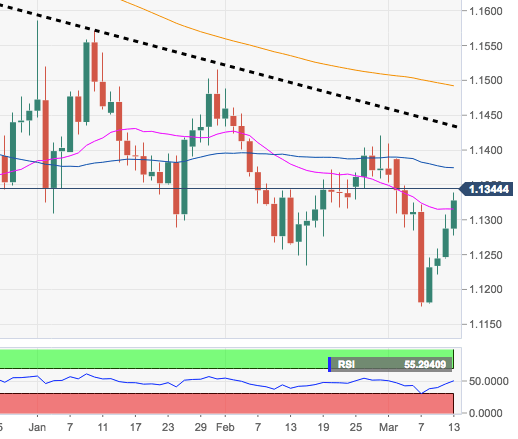
- EUR/USD is extending the recent up move after finding decent support in the 21-day SMA at 1.1319 earlier in the session.
- The up move in spot is now targeting the key 55-day SMA at 1.1365., considered the last defence of a test of late February peaks near 1.1420.
- On the broader picture, a test of YTD lows in the 1.1180/75 band remains on the cards as long as the multi-month resistance line – today at 1.1424 – caps the upside.
EUR/USD daily chart
EUR/USD
Overview:
Today Last Price: 1.1349
Today Daily change: 31 pips
Today Daily change %: 0.20%
Today Daily Open: 1.1326
Trends:
Daily SMA20: 1.132
Daily SMA50: 1.1366
Daily SMA100: 1.1369
Daily SMA200: 1.1487
Levels:
Previous Daily High: 1.1346
Previous Daily Low: 1.13
Previous Weekly High: 1.1346
Previous Weekly Low: 1.1222
Previous Monthly High: 1.1489
Previous Monthly Low: 1.1234
Daily Fibonacci 38.2%: 1.1328
Daily Fibonacci 61.8%: 1.1317
Daily Pivot Point S1: 1.1302
Daily Pivot Point S2: 1.1278
Daily Pivot Point S3: 1.1256
Daily Pivot Point R1: 1.1348
Daily Pivot Point R2: 1.1369
Daily Pivot Point R3: 1.1393
