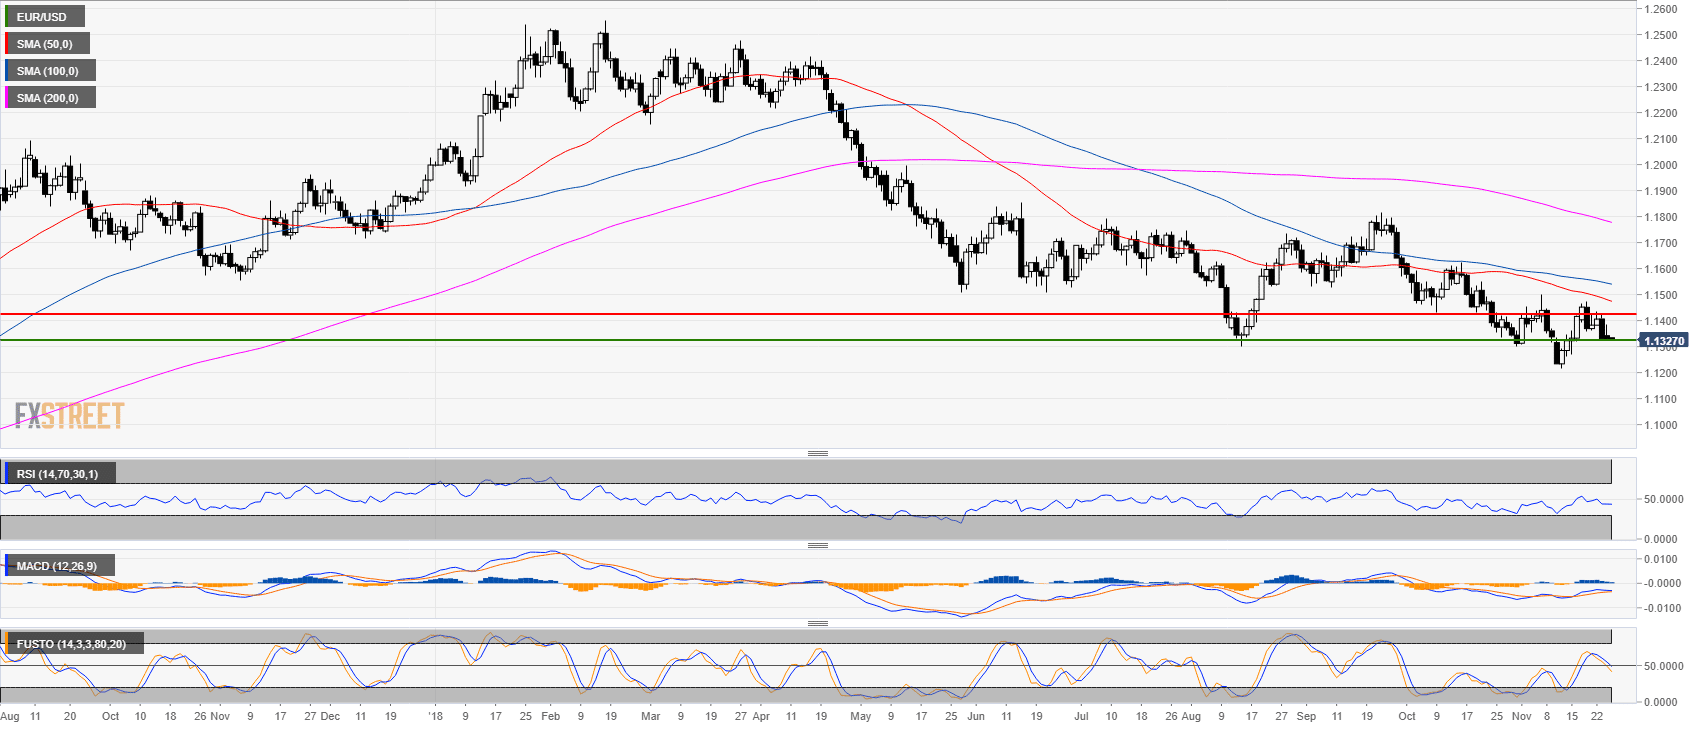
EUR/USD daily chart
- EUR/USD is trading in a bear trend below the main simple moving averages (SMAs).
- The RSI indicator is just below the 50 line, MACD is decelerating while Stochastic is breaking below the 50 mark.
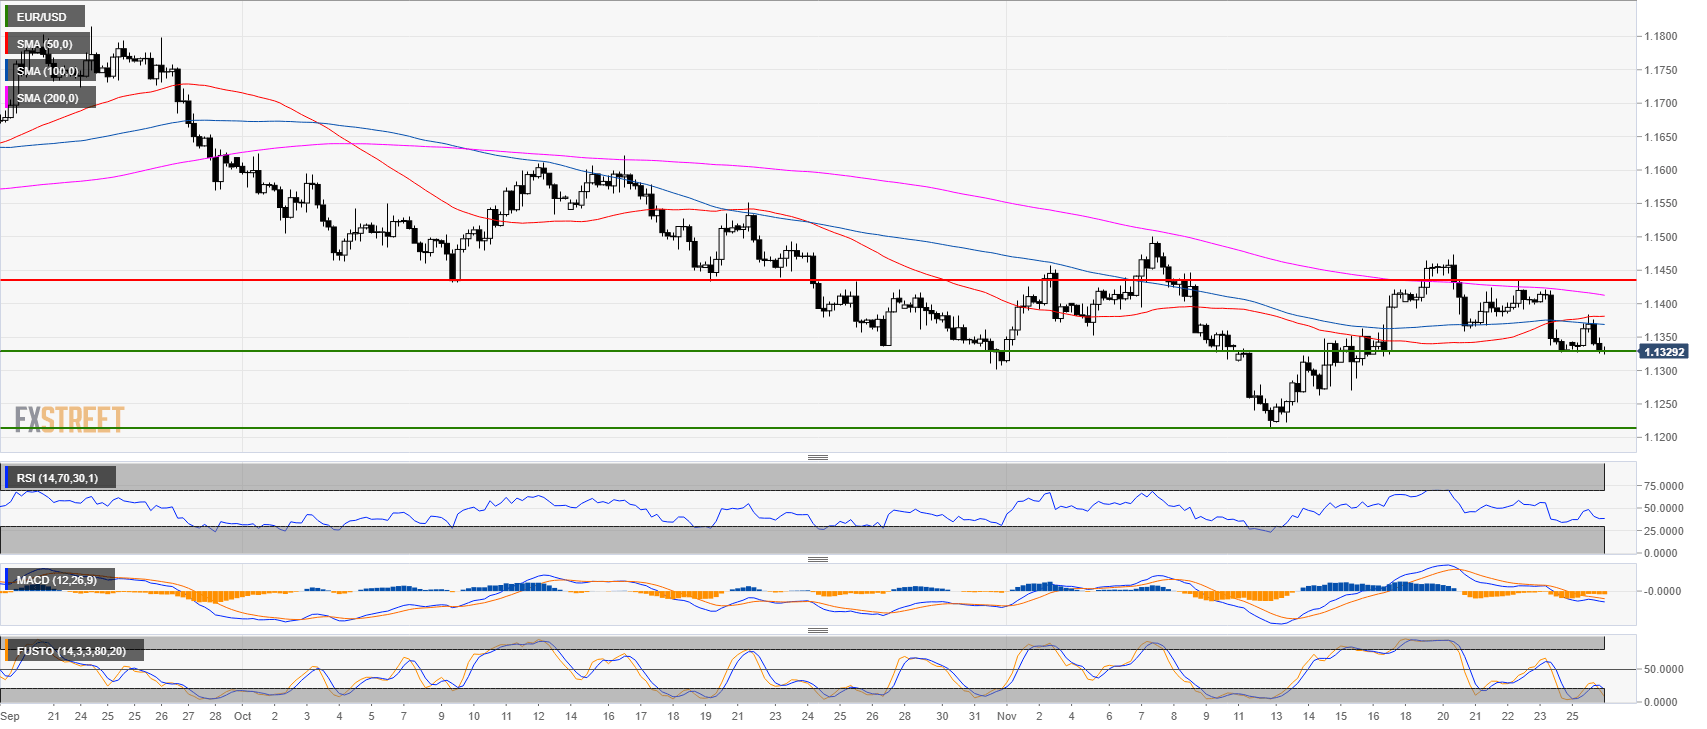
EUR/USD 4-hour chart
- The level to beat for bears is 1.1327. A break below the level could open the gates to the 2018 low.
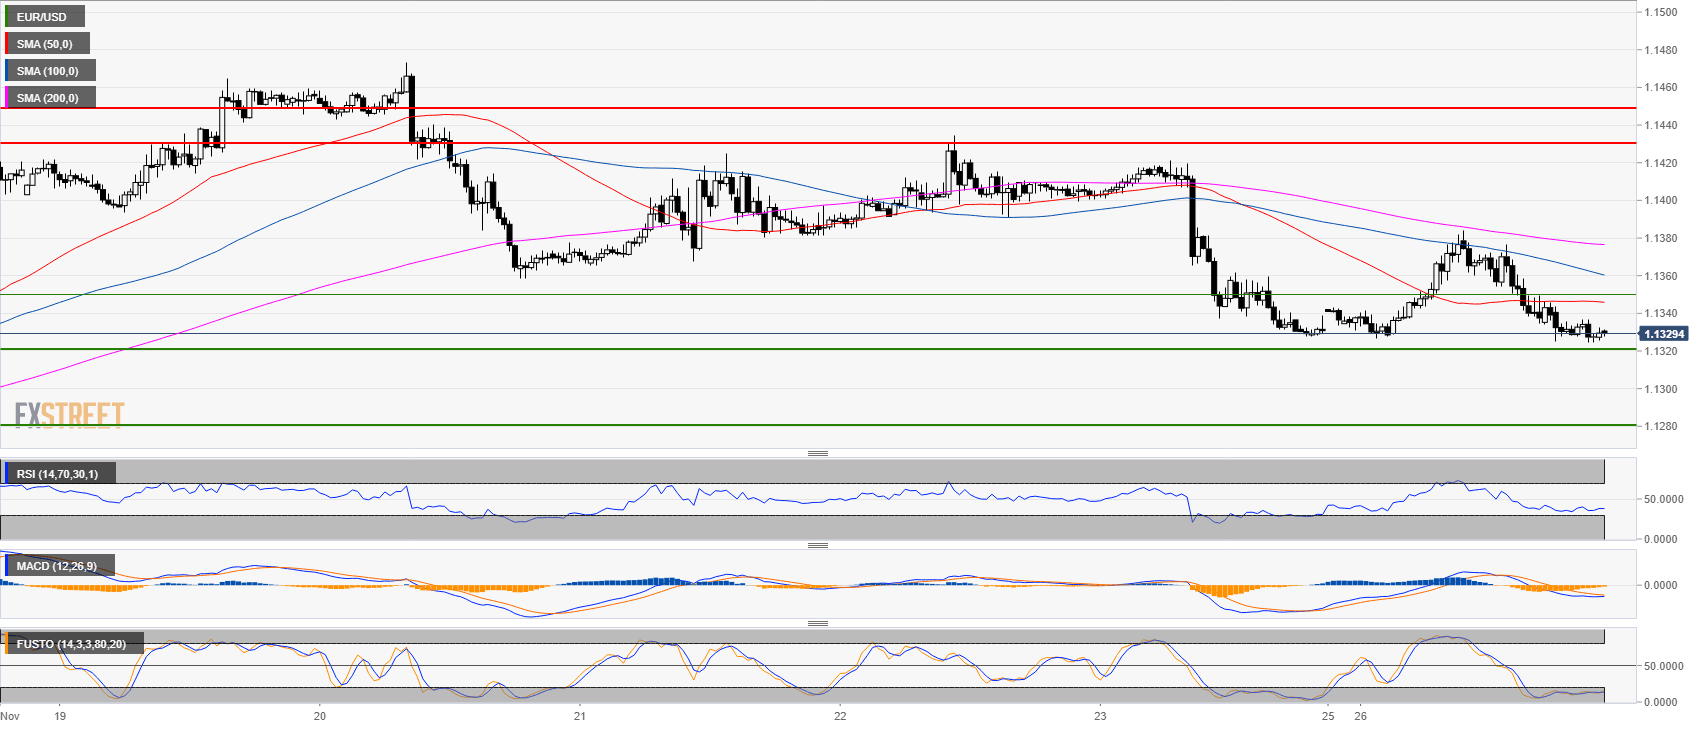
EUR/USD 30-minute chart
- EUR/USD is trading near the daily lows below the main SMAs.
- The Stochastic indicator is deeply oversold.
- A bounce from 1.1327 could lead to a bull run to the 1.1430 level.
Additional key levels
EUR/USD
Overview:
Today Last Price: 1.1329
Today Daily change: -1.0 pips
Today Daily change %: -0.00883%
Today Daily Open: 1.133
Trends:
Previous Daily SMA20: 1.1366
Previous Daily SMA50: 1.1488
Previous Daily SMA100: 1.1548
Previous Daily SMA200: 1.1791
Levels:
Previous Daily High: 1.1422
Previous Daily Low: 1.1328
Previous Weekly High: 1.1473
Previous Weekly Low: 1.1328
Previous Monthly High: 1.1625
Previous Monthly Low: 1.1302
Previous Daily Fibonacci 38.2%: 1.1364
Previous Daily Fibonacci 61.8%: 1.1386
Previous Daily Pivot Point S1: 1.1298
Previous Daily Pivot Point S2: 1.1266
Previous Daily Pivot Point S3: 1.1204
Previous Daily Pivot Point R1: 1.1392
Previous Daily Pivot Point R2: 1.1454
Previous Daily Pivot Point R3: 1.1487
