- EUR/USD carved out a bullish hammer candlestick pattern on Thursday.
- The daily chart shows a bullish indicator divergence.
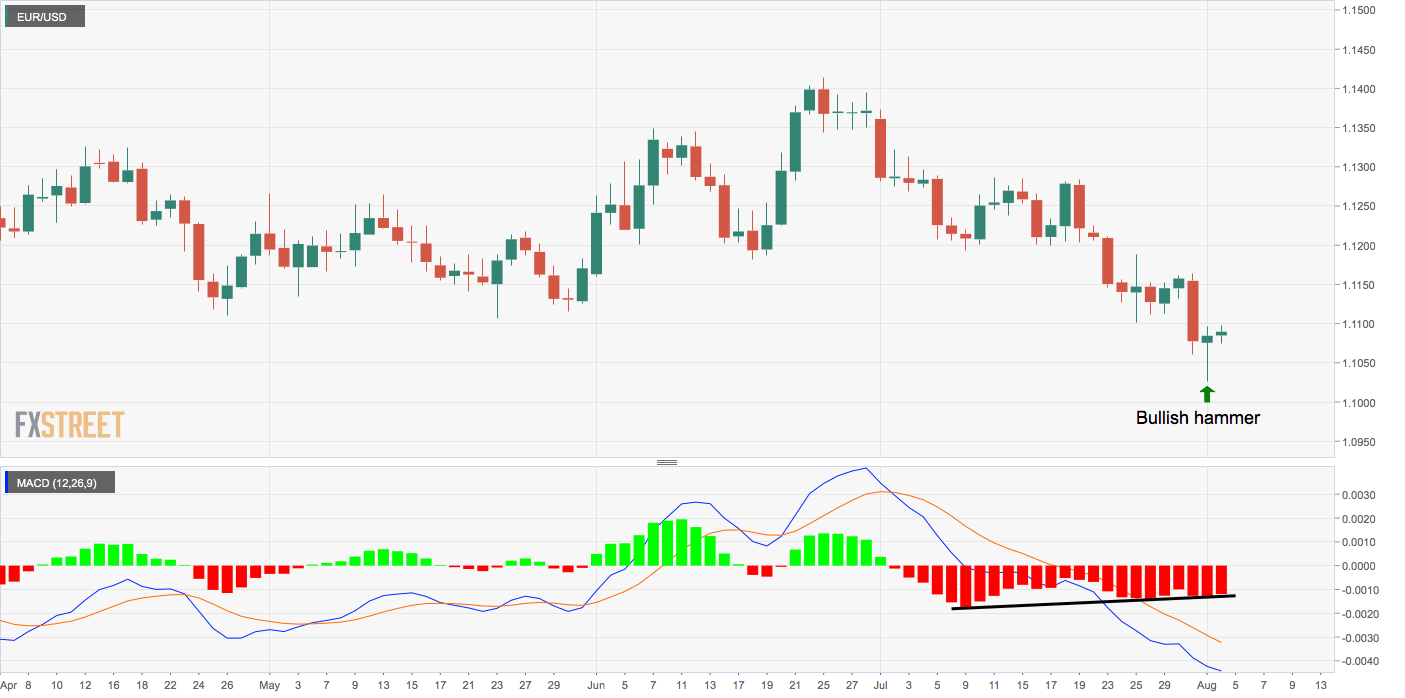
EUR/USD is looking north, having charted a bullish reversal candlestick pattern on Thursday.
The currency pair recovered sharply from the low of 1.1027 and closed the day with moderate gains, leaving a bullish hammer candle in its wake.
That candle is widely considered a sign of bearish-to-bullish trend change, especially when it appears after a notable sell-off, which is the case here.
Further, the moving average convergence divergence histogram on Thursday produced higher lows contradicting lower lows on the price chart (bullish divergence). That indicates seller exhaustion.
Al-in-all, the stage looks set for the pair to rise above 1.11. A close above Thursday’s high of 1.1096 would confirm bullish hammer reversal.
On the downside, the low of the hammer candle – 1.1027 – is the level to beat for the bears.
Daily chart
Trend: Bullish
Pivot points
