- RSI recovery could help clear the immediate upside barrier.
- The short-term triangle can limit the pair’s moves between 1.1265 and 1.1175.
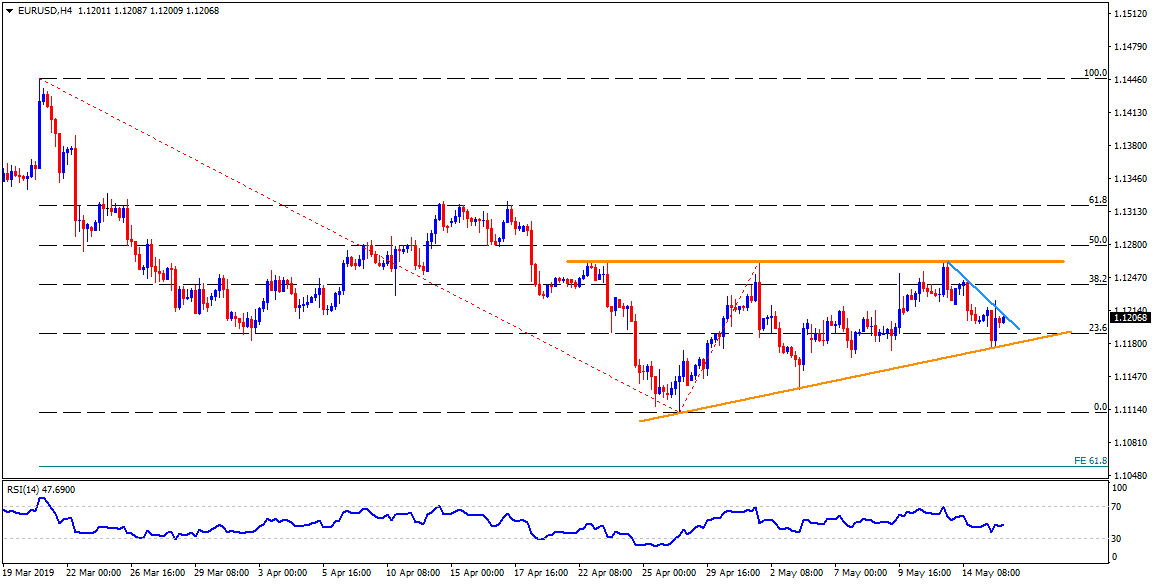
Despite bouncing off the support-line of a short-term ascending triangle, the EUR/USD pair is presently struggling with an immediate resistance-line, at 1.1210, during early Thursday.
Considering gradual improvement in 14-bar relative strength index (RSI), prices are likely to clear 1.1210 adjacent upside barrier and can rise further towards 1.1230 and 1.1245 resistance numbers.
However, upper-line of a three-week-old triangle pattern, near 1.1260/65, may question the quote’s additional upside, if not then its increase to 50% Fibonacci retracement of March to April downturn at 1.1280 and then to 1.1315/20 region comprising 61.8% Fibonacci retracement can be expected.
On the downside, 1.1175 acts as the key support as a break of which can recall 1.1140 and 1.1130 back on the chart.
During the pair’s extended south-run past-1.1130, 61.8% Fibonacci expansion (FE) of its March – April moves, at 1.1055 might please sellers.
EUR/USD 4-Hour chart
Trend: Positive
