- EUR/USD is closing on 1.13 in Asia.
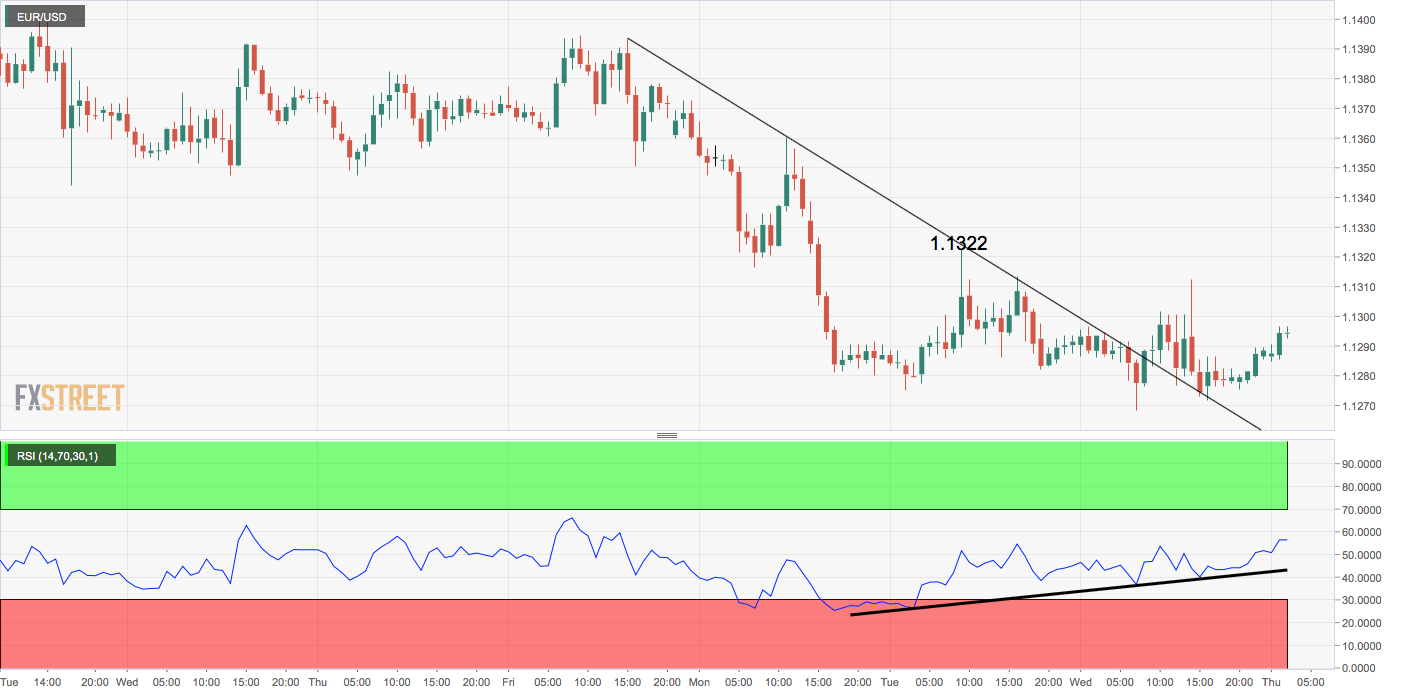
- Hourly chart shows upside break of descending trendline
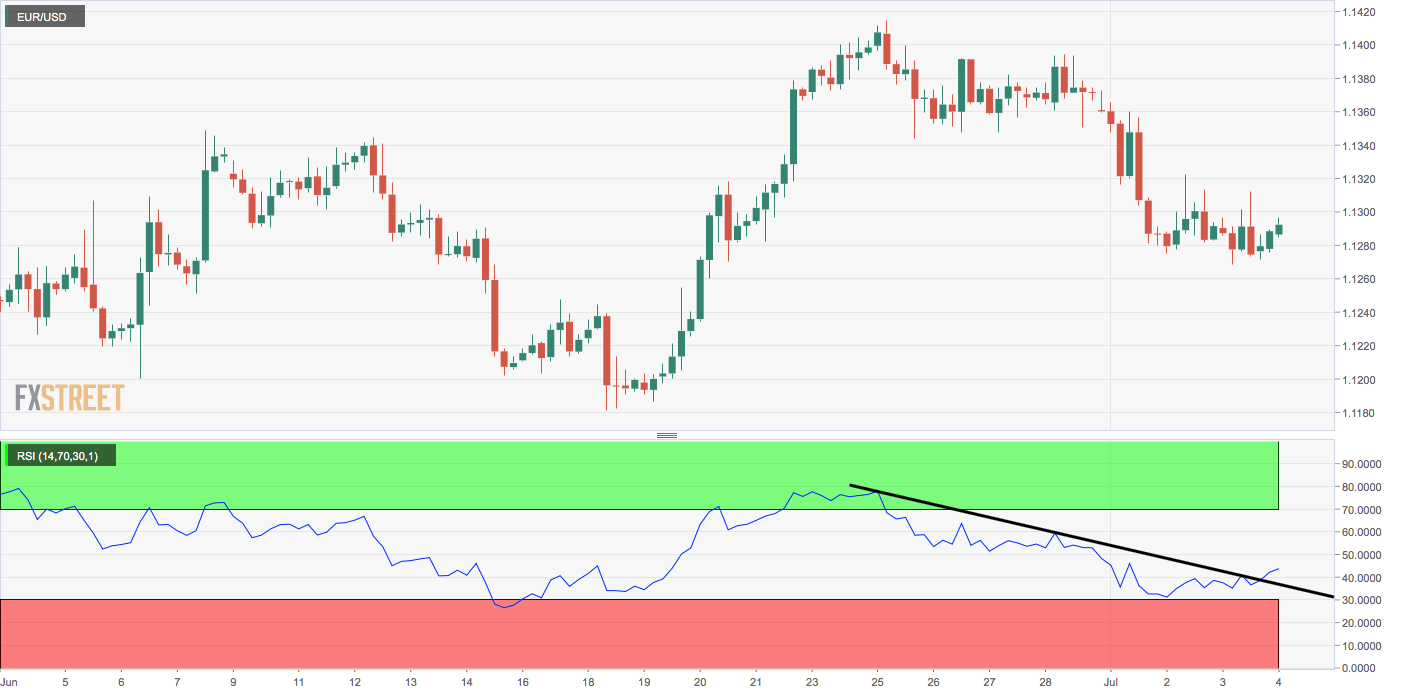
- RSI on both hourly and 4-hour charts is biased bullish.
EUR/USD has picked up a bid in Asia and could test resistance at 1.1322 during the day ahead, as the short duration technical indicators seem to have turned bullish.
Too start with, the hourly chart relative strength index (RSI) is now reporting bullish conditions with an above-50 print, having charted higher lows as opposed to lower lows on the price chart earlier this week.
Also, the pair has violated the descending trendline on the hourly chart.
Further, the RSI on the 4-hour chart has breached the descending trendline, indicating the pullback from recent highs above 1.14 has ended.
The pair, therefore, looks set to test the hourly chart resistance at 1.1322.
As of writing, the pair is trading at 1.1294, having hit a low of 1.1277 earlier today. The American Dollar is being offered across the board in Asia.
Hourly chart
4-hour chart
Trend: Bullish
Pivot points
