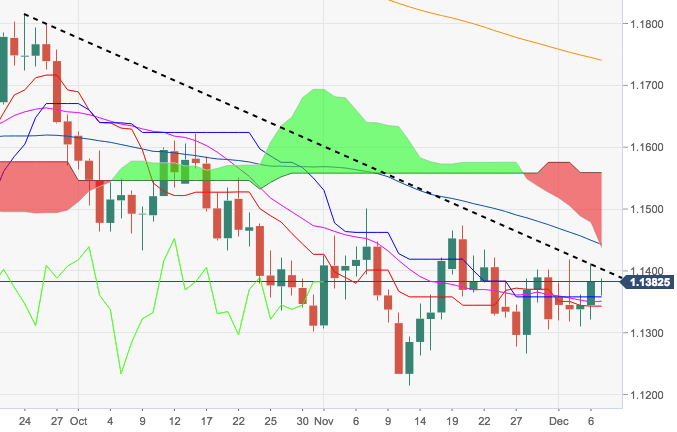
- The pair remains in a consolidative mode so far this week following another failed attempt to break above the 1.1400 handle in past sessions.
- EUR/USD continues to face strong resistance in the 1.1400 neighbourhood. This area is now reinforced by the short-term resistance line at 1.1403.
- Immediate hurdle remains at recent peaks in the 1.1410/20 band ahead of the more relevant 1.1470/80 area.
EUR/USD daily chart
EUR/USD
Overview:
Today Last Price: 1.1375
Today Daily change: -7.0 pips
Today Daily change %: -0.0615%
Today Daily Open: 1.1382
Trends:
Previous Daily SMA20: 1.1349
Previous Daily SMA50: 1.1421
Previous Daily SMA100: 1.1518
Previous Daily SMA200: 1.1746
Levels:
Previous Daily High: 1.1413
Previous Daily Low: 1.1321
Previous Weekly High: 1.1402
Previous Weekly Low: 1.1267
Previous Monthly High: 1.15
Previous Monthly Low: 1.1216
Previous Daily Fibonacci 38.2%: 1.1378
Previous Daily Fibonacci 61.8%: 1.1356
Previous Daily Pivot Point S1: 1.1331
Previous Daily Pivot Point S2: 1.128
Previous Daily Pivot Point S3: 1.124
Previous Daily Pivot Point R1: 1.1423
Previous Daily Pivot Point R2: 1.1464
Previous Daily Pivot Point R3: 1.1515
