- EUR/USD recovers from 200-bar SMA, 61.8% Fibonacci retracement.
- MACD turning bullish, immediate resistance line caps the run-up.
EUR/USD trades mildly bid near 1.1090 during early Tuesday. That said, the pair recently bounced off the 200-bar Simple Moving Average (SMA) and 61.8% Fibonacci retracement of November 29 to December 12 upside.
While bullish signals from 21-bar Moving Average Convergence and Divergence (MACD) indicate extended run-up, a falling trend line since December 12, at 1.1110, limits the pair’s nearby upside.
In a case where buyers cross the immediate barrier, 1.1175/80 might offer an intermediate halt during the rise towards the monthly top of 1.1200.
Alternatively, a sustained break below the confluence of 200-bar SMA and 61.8% Fibonacci retracement, around 1.1068/65, can drag prices to December 06 low of 1.1040 ahead of highlighting the November-end bottom surrounding 1.0980.
EUR/USD four-hour chart
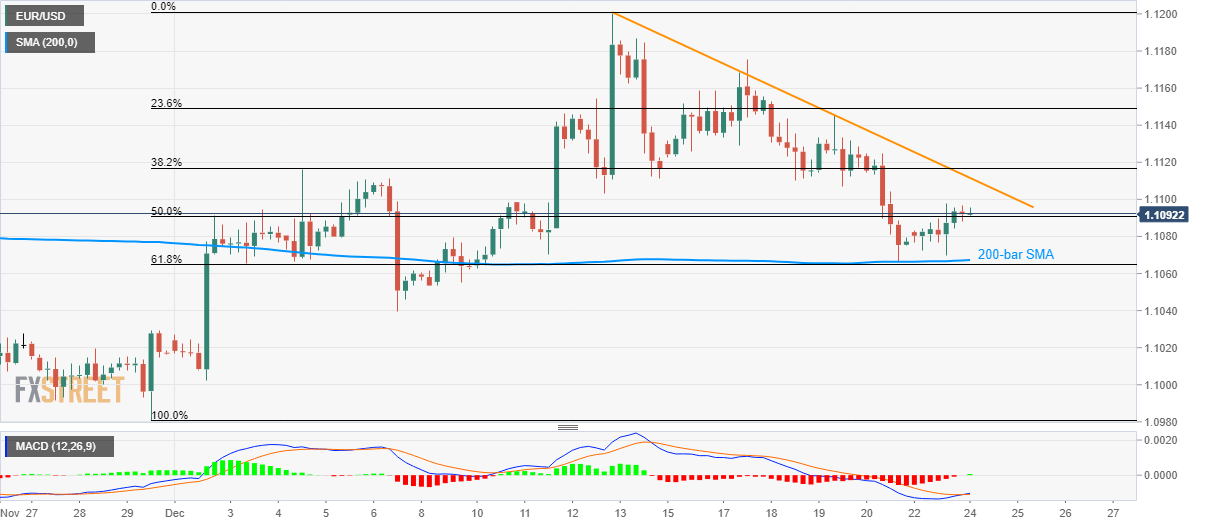
Trend: Pullback expected
