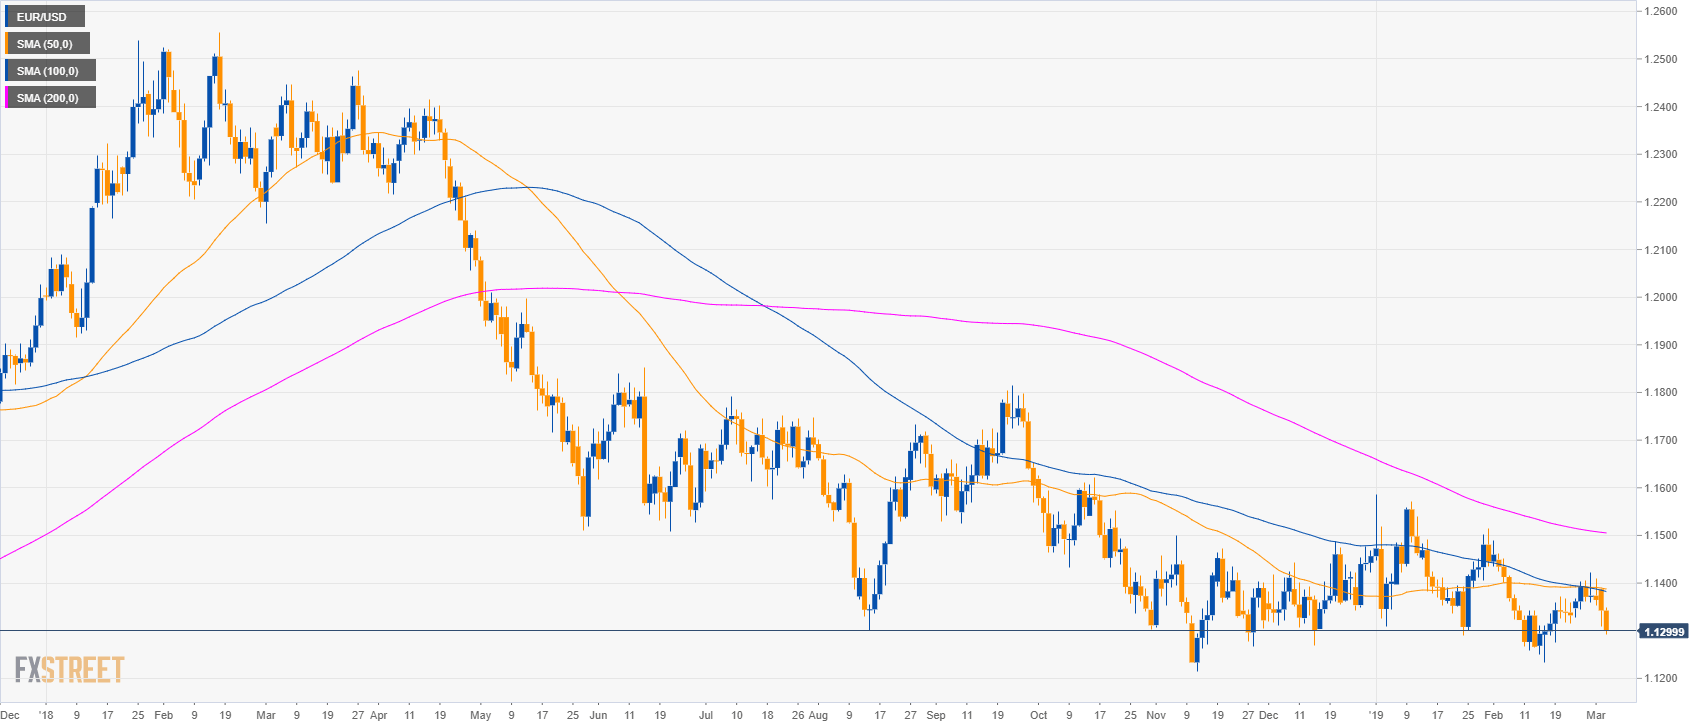
EUR/USD daily chart
- EUR/USD is trading in a bear trend below its main simple moving averages (SMAs).
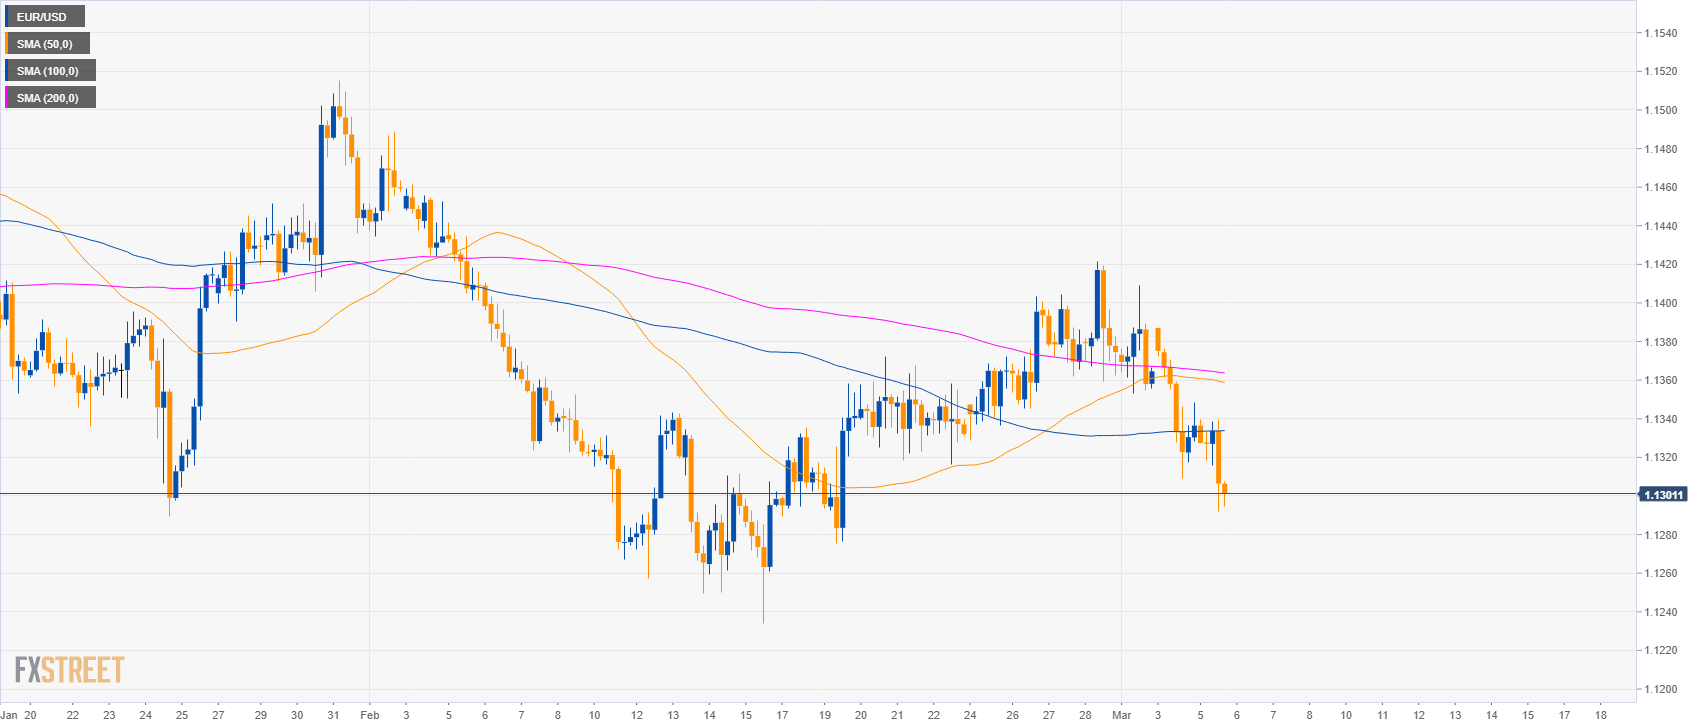
EUR/USD 4-hour chart
- EUR/USD is trading below its main SMAs suggesting a bearish bias in the medium-term.
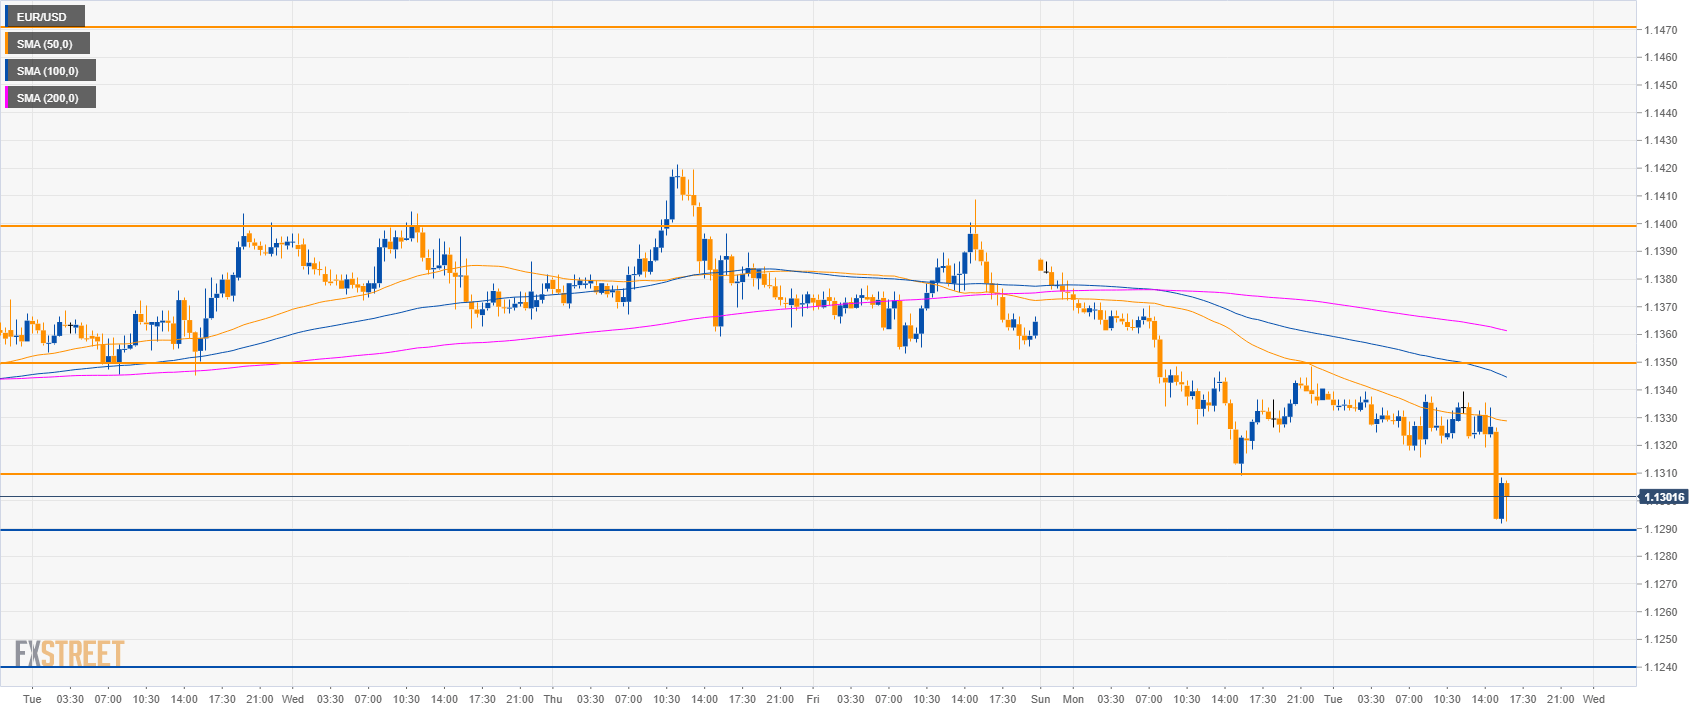
EUR/USD 30-minute chart
- EUR/USD is trading below its main SMAs suggesting bearish momentum in the short-term.
- 1.1290 is a key support and if broken the next significant level becomes the 1.1240 level.
- The intraday bear move might be over and bulls can target 1.1310, 1.1350 and 1.1400 figure which can be reached in the coming days.
Additional key levels
EUR/USD
Overview:
Today Last Price: 1.1296
Today Daily change: -46 pips
Today Daily change %: -0.41%
Today Daily Open: 1.1342
Trends:
Daily SMA20: 1.1339
Daily SMA50: 1.139
Daily SMA100: 1.1385
Daily SMA200: 1.1506
Levels:
Previous Daily High: 1.1388
Previous Daily Low: 1.1309
Previous Weekly High: 1.1422
Previous Weekly Low: 1.1328
Previous Monthly High: 1.1489
Previous Monthly Low: 1.1234
Daily Fibonacci 38.2%: 1.1339
Daily Fibonacci 61.8%: 1.1358
Daily Pivot Point S1: 1.1305
Daily Pivot Point S2: 1.1268
Daily Pivot Point S3: 1.1227
Daily Pivot Point R1: 1.1384
Daily Pivot Point R2: 1.1425
Daily Pivot Point R3: 1.1462
