- Spot failed to advance further north of the 1.1750 area on Monday, sparking the subsequent leg lower to the current 1.1650/40 band.
- Initial resistance emerges in the 1.1681/88 band, where converge the 55-, 10- and 21-day SMA. The base of the daily cloud also reinforces this resistance zone.
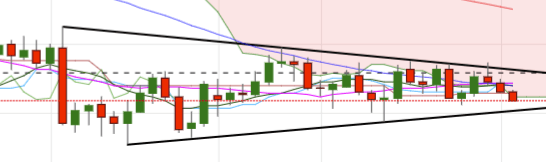
- Investors are looking for a breakout of the pennant pattern charted from June’s 1.1853 and 1.1509.
- In the meantime, the near term outlook for the pair remains negative while below the resistance line, today at 1.1728.
Daily high: 1.1668
Daily low: 1.1632
Support Levels
S1: 1.1645
S2: 1.1630
S3: 1.1602
Resistance Levels
R1: 1.1687
R2: 1.1715
R3: 1.1730
