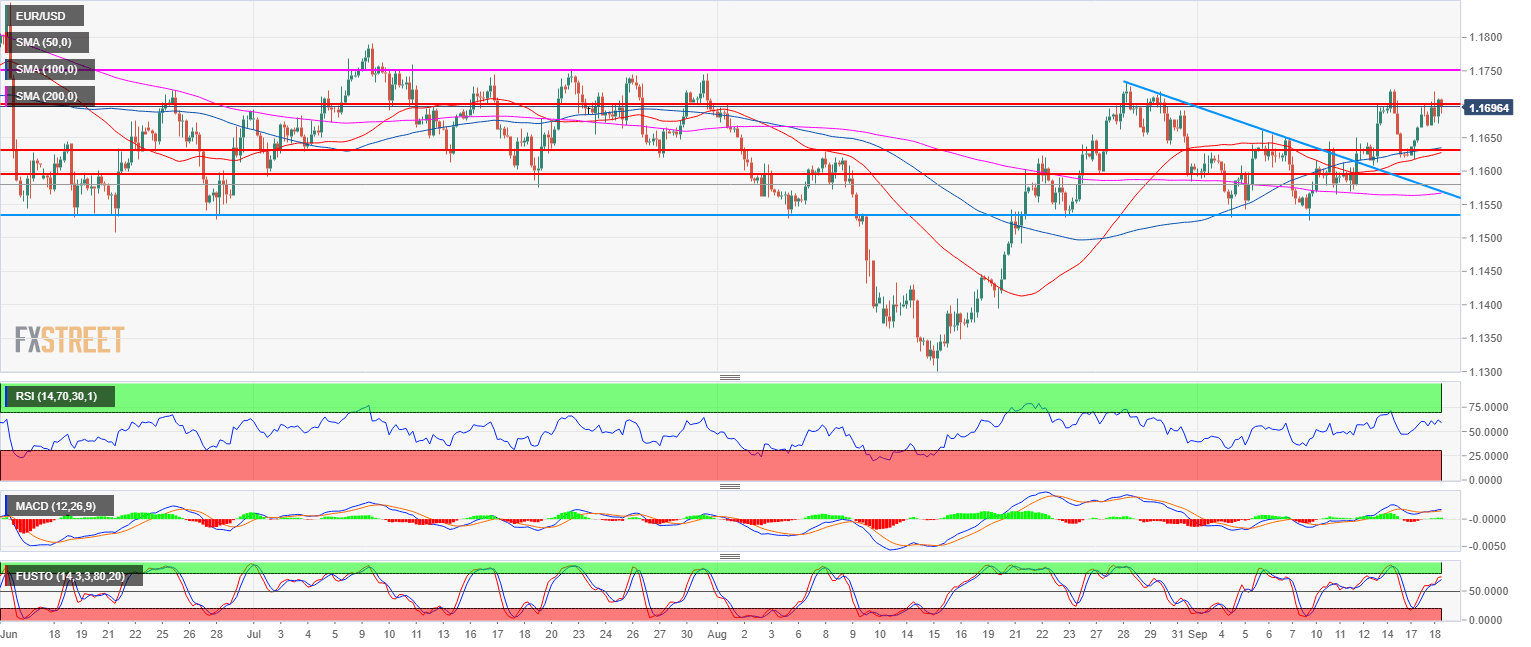
- EUR/USD main bear trend is on hold for the sixth consecutive week as the bulls are trying to create a reversal up.
- EUR/USD is currently consolidating the recent advance from the triangle compression pattern (blue lines) just below the 1.1700 level. EUR/USD is trading above its 50, 100 and 200-period simple moving average on the 4-hour chart suggesting a bullish bias. Bulls objective is to break above 1.1750 which was a strong resistance level in July, therefore it is to be expected that bulls take time to gather enough momentum in order to breakout above 1.1750 level.
- On the flip side, if the bears take over the market and drive it below 1.1530 it would likely signify that the bullish bias has switched to bearish.
Spot rate: 1.1700
Relative change: 0.16%
High: 1.1718
Low: 1.1666
Main trend: Bearish
Short-term trend: Bullish above 1.1530
Resistance 1: 1.1722 last week high
Resistance 2: 1.1750 key resistance (July)
Resistance 3: 1.1800 figure
Resistance 4: 1.1853 June 14 high
Support 1: 1.1654 August 27 high
Support 2: 1.1630 August 8 high key level
Support 3: 1.1600 figure
Support 4: 1.1572 July 19 low
Support 5: 1.1542 supply/demand level
Support 6: 1.1530 August 23 swing low
Support 7: 1.1508 June 8 low
