- EUR/USD trade near 1.1325 during early Thursday.
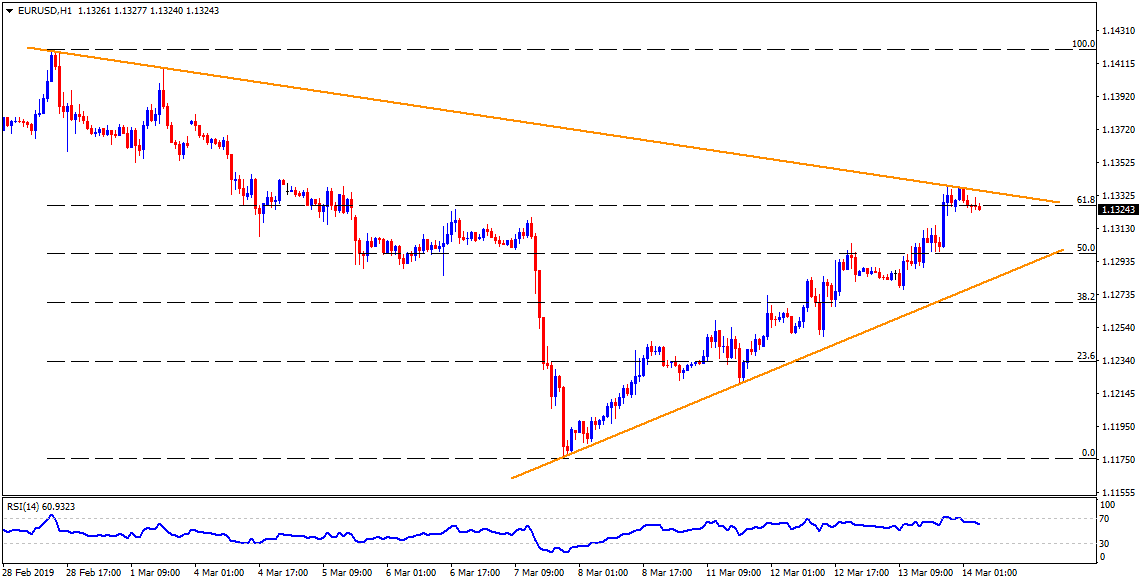
- The pair recently reversed from a downward sloping resistance-line stretched since February 28, also forming a part of the short-term symmetrical triangle.
- The pullback from formation resistance signal brighter chances of the pair’s further weakness towards 1.1310 and then to 1.1300.
- However, pattern support, at 1.1280, could confine pair’s additional declines, if not then 1.1250 and 1.1220 can become sellers’ favorites.
- On the contrary, pair’s ability to conquer 1.1335 resistance-line can trigger its recovery to 1.1355 and 1.1380 numbers to the north.
- Also, pair’s sustained advances past-1.1380 might not hesitate flashing 1.1400 and 1.1425 on the chart.
EUR/USD hourly chart
Additional important levels:
Overview:
Today Last Price: 1.1325
Today Daily change: -3 pips
Today Daily change %: -0.03%
Today Daily Open: 1.1328
Trends:
Daily SMA20: 1.1318
Daily SMA50: 1.1369
Daily SMA100: 1.137
Daily SMA200: 1.1492
Levels:
Previous Daily High: 1.134
Previous Daily Low: 1.1278
Previous Weekly High: 1.1388
Previous Weekly Low: 1.1176
Previous Monthly High: 1.1489
Previous Monthly Low: 1.1234
Daily Fibonacci 38.2%: 1.1316
Daily Fibonacci 61.8%: 1.1301
Daily Pivot Point S1: 1.129
Daily Pivot Point S2: 1.1253
Daily Pivot Point S3: 1.1228
Daily Pivot Point R1: 1.1352
Daily Pivot Point R2: 1.1377
Daily Pivot Point R3: 1.1414
