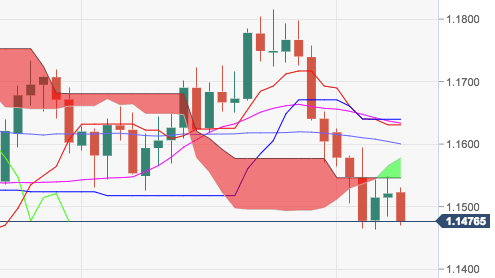
- EUR/USD has started the week on a negative fashion after two consecutive daily advances.
- The pair is now trading closer to recent lows in the 1.1460 region, and a break below this level should open the door for a visit to 1.1449 (Fibo retracement of the 2017-2018 up move) and the 200-week SMA in the 1.1330 region.
- Further south lies the 2018 low at 1.1299 (August 15), which is expected to come to the fore if the selling bias accelerates.
- Also fuelling the idea of extra downside, spot has broken below the base of the cloud both in the daily and weekly charts.
EUR/USD
Overview:
Last Price: 1.1478
Daily change: -43 pips
Daily change: -0.373%
Daily Open: 1.1521
Trends:
Daily SMA20: 1.1641
Daily SMA50: 1.1597
Daily SMA100: 1.1638
Daily SMA200: 1.1933
Levels:
Daily High: 1.155
Daily Low: 1.1484
Weekly High: 1.1625
Weekly Low: 1.1464
Monthly High: 1.1816
Monthly Low: 1.1464
Daily Fibonacci 38.2%: 1.1525
Daily Fibonacci 61.8%: 1.1509
Daily Pivot Point S1: 1.1487
Daily Pivot Point S2: 1.1452
Daily Pivot Point S3: 1.1421
Daily Pivot Point R1: 1.1553
Daily Pivot Point R2: 1.1584
Daily Pivot Point R3: 1.1619
