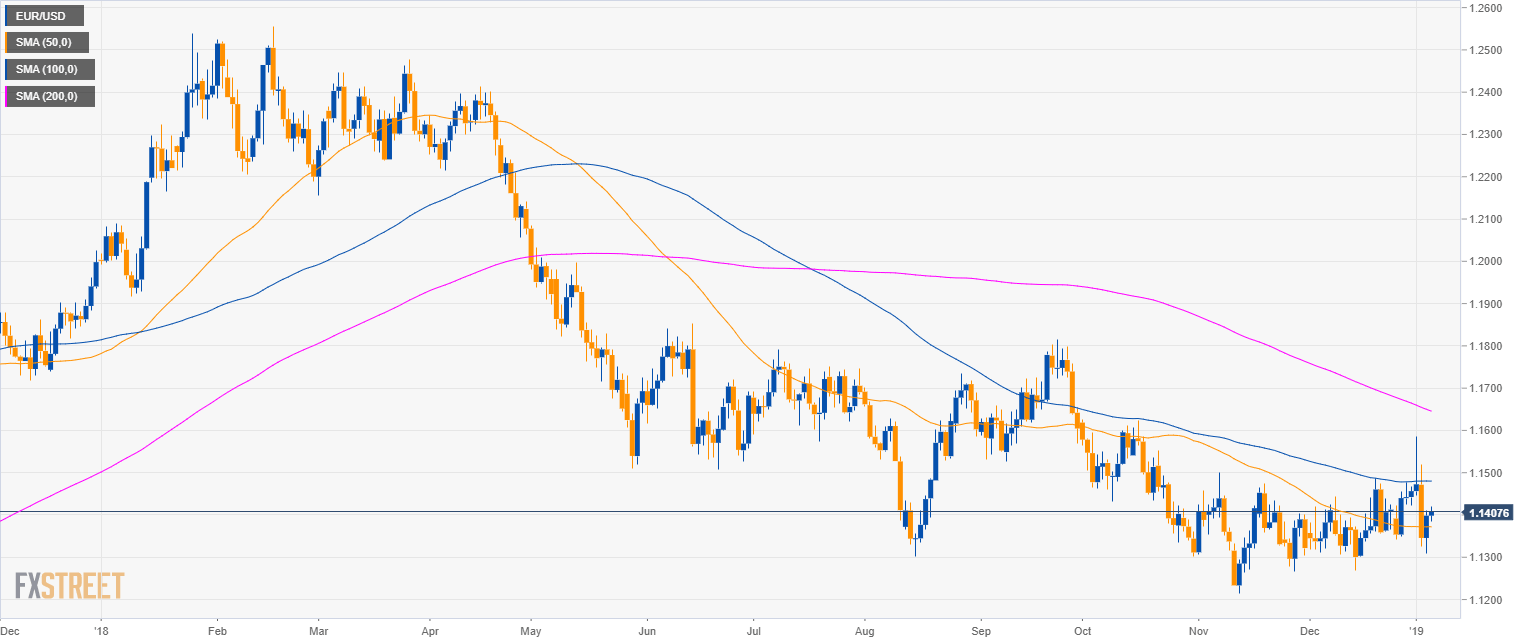
EUR/USD daily chart
- EUR/USD is trading in a bear trend below the 200-period simple moving average (SMA).
- The US nonfarm payrolls (NFP) at 13.30 GMT will likely provide high volatility in the forex market.
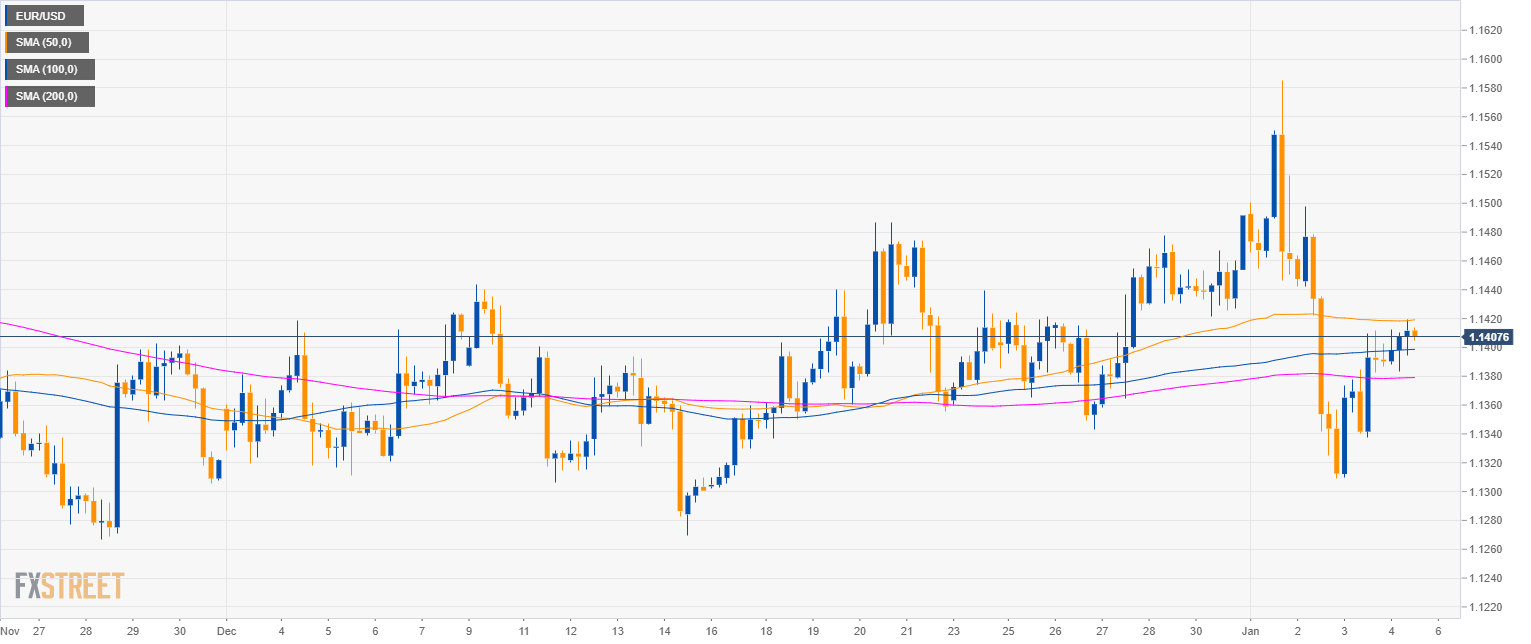
EUR/USD 4-hour chart
- EUR/USD is currently challenging the 50 SMA and the 1.1400 figure.
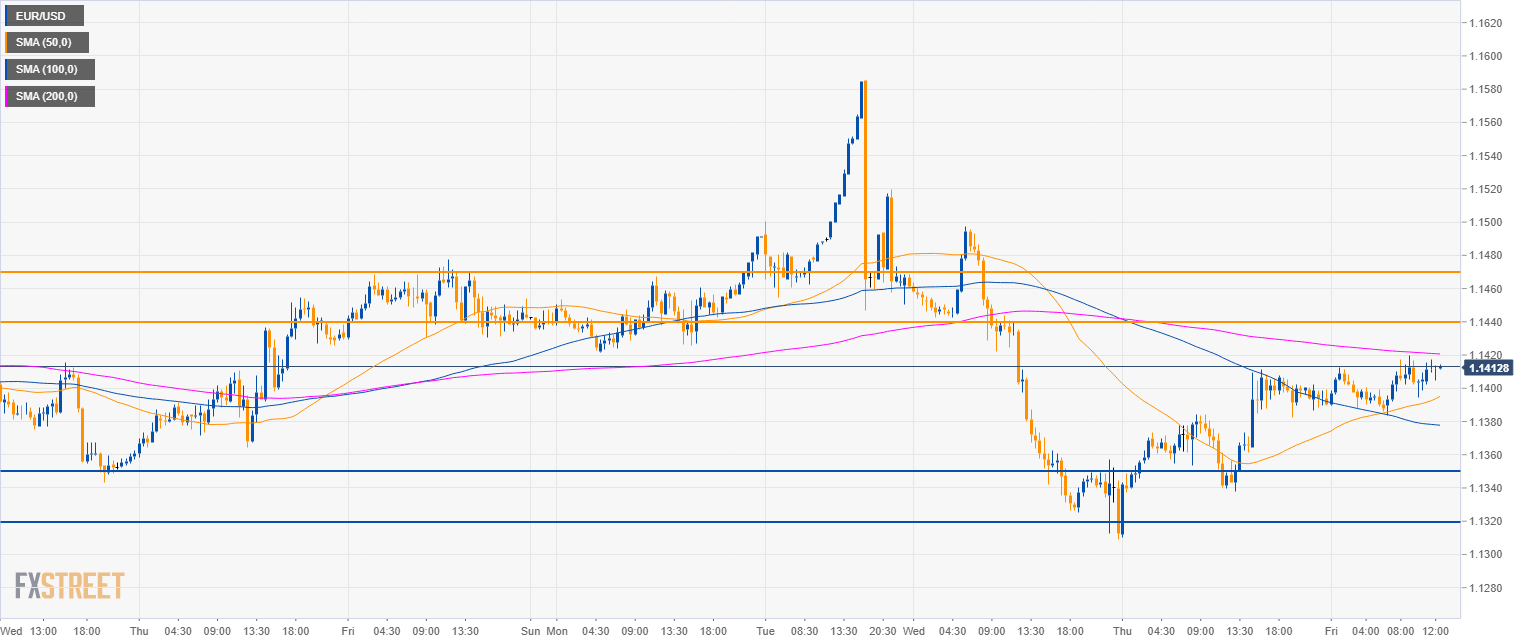
EUR/USD 30-minute chart
- EUR/USD is currently capped by the 200 SMA.
- The level to beat for bulls is 1.1440 and 1.1470 while to the downside 1.1350 and 1.1320 are seen as potential bear targets.
- Since the main trend is bearish the bears are likely in charge.
Additional key levels
EUR/USD
Overview:
Today Last Price: 1.1412
Today Daily change: 14 pips
Today Daily change %: 0.123%
Today Daily Open: 1.1398
Trends:
Previous Daily SMA20: 1.1388
Previous Daily SMA50: 1.1372
Previous Daily SMA100: 1.148
Previous Daily SMA200: 1.1652
Levels:
Previous Daily High: 1.1412
Previous Daily Low: 1.1309
Previous Weekly High: 1.1478
Previous Weekly Low: 1.1343
Previous Monthly High: 1.1486
Previous Monthly Low: 1.1269
Previous Daily Fibonacci 38.2%: 1.1372
Previous Daily Fibonacci 61.8%: 1.1348
Previous Daily Pivot Point S1: 1.1335
Previous Daily Pivot Point S2: 1.1271
Previous Daily Pivot Point S3: 1.1232
Previous Daily Pivot Point R1: 1.1437
Previous Daily Pivot Point R2: 1.1475
Previous Daily Pivot Point R3: 1.1539
