EURUSD Daily Analysis
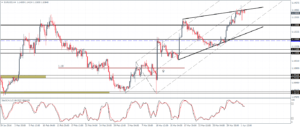
EURUSD (1.13): EURUSD closed Friday’s session above 1.13 settling at 1.139. Price action closed with a small bodied candlestick pattern, and if today’s session closes on a bearish note, we can anticipate a short-term correction lower. However, prices remain biased to the upside with the previously broken resistance at 1.13 now likely to turn into support. In the case of a dip below 1.13, 1.12 support comes into play next. To the upside, 1.147 which marks the 14th September 2015 higher close will be the next resistance level of interest.
USDJPY Daily Analysis
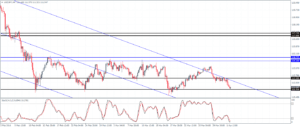
USDJPY (111.5): USDJPY slipped below 112.0 support on Friday closing with a strong bearish engulfing candlestick pattern which could indicate further downside. Prices are currently supported near the lows of 111.430 which was previously held on 17th March. A daily close below this level could see further downside, but in the event of a move above 112.0 USDJPY could see some of the losses being reclaimed. On the 4-hour chart, resistance can be seen at 112.0 – 112.50 levels and an upside bias will be built only on a close above this resistance level for a test to 114.35 – 114.7.
GBPUSD Daily Analysis
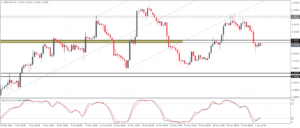
GBPUSD (1.42): GBPUSD closed Friday’s session on a bearish note following the two doji candlesticks earlier in the week near 1.4425 resistance. Minor support at 1.42 was briefly tested on Friday, but we expect to see a further test back to this level. On the 4-hour chart, with the support level being cleared at 1.4263 – 1.4247, GBPUSD could see a continued downside move to 1.4025 – 1.40 lower support in the near term.
Gold Daily Analysis
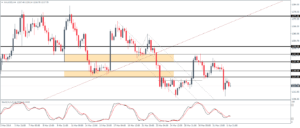
XAUUSD (1217): Gold prices continue to drift gradually lower. Price action was bearish on Friday, but the daily chart was supported by the 50 period EMA. On the 4-hour chart, prices closed below 1230 – 1225 support/resistance which could confirm further downside. A brief retest to establish resistance at the newly broken support level would confirm the downside bias which will see Gold dip to the $1200 psychological support.
