EURUSD Daily Analysis
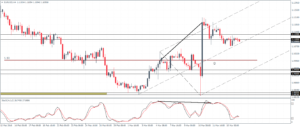
EURUSD (1.10): EURUSD formed a doji pattern yesterday but the downside remains open towards 1.10 – 1.09 support. Price remains consolidating just below the resistance at 1.113 – 1.1105 which if holds could see the upside limited. Below 1.09 support, EURUSD could decline to as low at 1.0825 – 1.0835 which was barely tested during last week’s ECB meeting. With the FOMC meeting due later today and US economic data EURUSD could see some significant volatility into the meeting. In the event that EURUSD breaks above 1113 – 1.1105, a test to the next resistance near 1.12 – 1.13 could be possible.
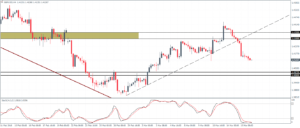
USDJPY Daily Analysis
USDJPY (113.4): USDJPY closed on a bearish note yesterday and could see a risk to the downside for 112.0 support. On the 4-hour chart price action remains flat with no clear bias being established just as yet. In this aspect, there is a strong indication that USDJPY could breakout from its range during the FOMC meeting. Watch for 112.0 – 112.5 support level, which if breaks could see a test to 111.0, while to the upside above 114.7 – 114.35 resistance, 117 – 117.25 will be the next resistance level of interest.
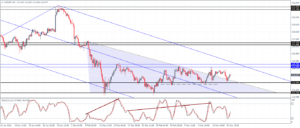
GBPUSD Daily Analysis
GBPUSD (1.41): GBPUSD has declined strongly following a brief test of resistance near 1.435 – 1.43 and is now trading below 1.420. Any upside gains are likely to be limited below 1.43 resistance while a decline to 14025 – 1.40 is very likely. UK jobs report will be due for release today which could be the main fundamental risk aside from the US data due later in the evening.
Gold Daily Analysis
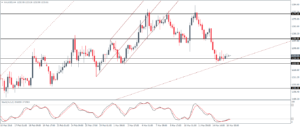
XAUUSD (1233): Gold has broken out from the rising wedge pattern on the daily chart and is now trading below the $1250 support. A rally back to this level to establish resistance could pave the way for a dip to $1200 with prices currently trading near the 1230 – 1225 support level.
