EURUSD Daily Pivots
| R3 | 1.1521 |
| R2 | 1.1485 |
| R1 | 1.1426 |
| Pivot | 1.139 |
| S1 | 1.1331 |
| S2 | 1.1295 |
| S3 | 1.1236 |
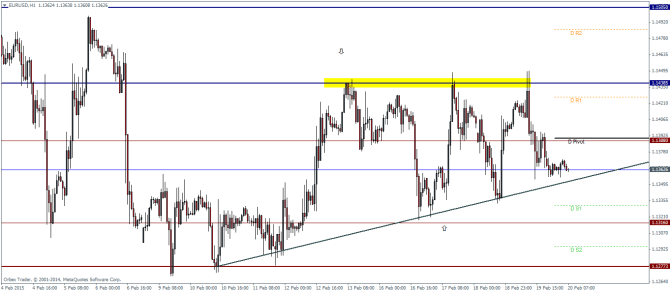
EURUSD continues to move within the range of 1.14 and 1.13 levels. The intraday H1 charts however show that price action is heading towards a congestion zone and that a break out to either direction is quite possible. In one aspect, the current consolidation looks to be forming an ascending triangle pattern which gives an upside objective towards 1.1505 levels. However, with the rising trend line being tested quite a few times, a break out from this trend line is also quite possible, which would then see EURUSD decline down to 1.13 followed by 1.127 levels.
USDJPY Daily Pivots
| R3 | 120.018 |
| R2 | 119.6 |
| R1 | 119.272 |
| Pivot | 118.854 |
| S1 | 118.526 |
| S2 | 118.108 |
| S3 | 117.780 |
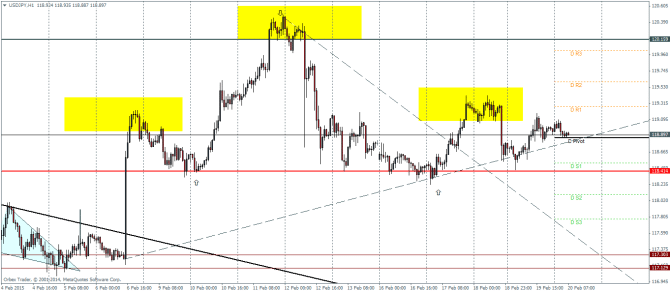
USDJPY seems to be taking a bit longer than anticipated in the large head and shoulders pattern that is taking shape. Plotting some trend lines within this pattern we can see that a break of the rising trend line would give an initial confirmation of a decline to the downside followed by a break of support nera the neck line at 118.414 levels. To the further downside we can expect the falling trend line to act as a dynamic support.
However, should we see any of the support levels (the rising trend line, or even the neckline) hold prices, we can expect further consolidation to take place before price action prepares for a break out.
GBPUSD Daily Pivots
| R3 | 1.5512 |
| R2 | 1.5488 |
| R1 | 1.5451 |
| Pivot | 1.5427 |
| S1 | 1.539 |
| S2 | 1.5365 |
| S3 | 1.5328 |
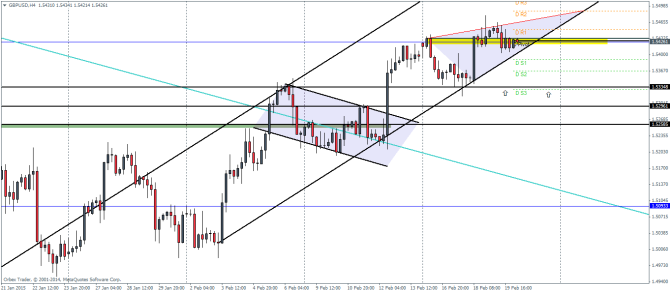
GBPUSD failed to hold on to the support at 1.543 levels and dipped below this price zone. In the process we notice a rising wedge/triangle pattern being formed at the top. This pattern indicates a downside objective towards 1.5335 levels, which incidentally happens to be a previously identified support level.
Unless price fails to close higher with conviction above 1.5432, we can expect some weakness in the GBPUSD within the next few days.
