EURUSD Daily Pivots
| R3 | 1.2919 |
| R2 | 1.2867 |
| R1 | 1.2833 |
| Pivot | 1.2781 |
| S1 | 1.2747 |
| S2 | 1.2696 |
| S3 | 1.2661 |
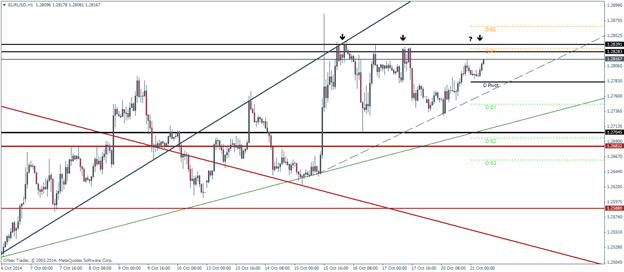
The EURUSD looks to be heading towards testing a long term resistance level at 1.283 level, which managed to hold in the past two occasions. A successful test of resistance could see the first decline towards the daily pivot at 1.27819, which also shows confluence with a short term rising trend line. A break of this level would indicate a decline towards the major support lower below the daily support level 1 at 1.2747.
USDJPY Daily Pivots
| R3 | 107.91 |
| R2 | 107.652 |
| R1 | 107.3 |
| Pivot | 107.042 |
| S1 | 106.69 |
| S2 | 106.432 |
| S3 | 106.08 |
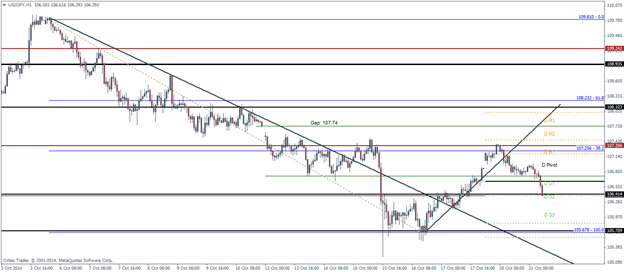
From the daily pivot levels, we notice that the range of the USDJPY has reduced quite significantly, pointing to a possible break out later in the week. USDJPY yet again failed to fill the gap at 107.74 and broke below the short term rising trend line with current price action testing the support level at 106.4. Further declines could target the next H1 charts bottom at 105.678. Alternatively, a rally from the 106.4 support could target the longer term resistance at 107.35
GBPUSD Daily Pivots
| R3 | 1.6301 |
| R2 | 1.624 |
| R1 | 1.6202 |
| Pivot | 1.6141 |
| S1 | 1.6103 |
| S2 | 1.6042 |
| S3 | 1.6 |
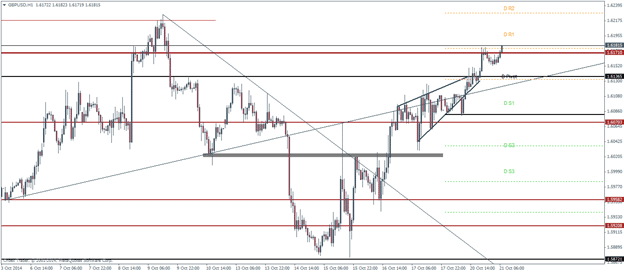
A fake-out from the ascending wedge found support near the support level of 1.61 after which GBPUSD managed to push higher to settle back into the ascending wedge. The cable is now trading near a long term resistance at 1.6171 which saw a small decline on the first attempt. A break above the resistance could see the cable targeting the H1 chart’s top at 1.62145. At the end of the ascending wedge we also see a small bullish flag pattern with the break out occurring quite recently, this small pattern gives a target to 1.625, just a few pips below the major resistance at 1.627 – 1.629 (not shown on chart). The risk to the minor bullish flag of course comes from the overhead resistance level right above the flag pattern.
