EURUSD Daily Analysis
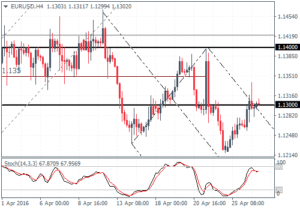
EURUSD (1.13): EURUSD is bouncing back with prices closing near the 1.13 handle yesterday. However, this is a level of minor resistance which could see prices struggle to break higher, but in the event of a close above 1.130, further upside could be extended towards 1.140, which could be seen if EURUSD attempts to breakout higher from the outer median line. To the downside, 1.120 is a clear support level which could hold prices in the near term.
USDJPY Daily Analysis
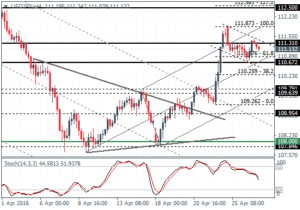
USDJPY (111.0): USDJPY price action was muted yesterday, but the bias still remains to the downside. A daily close below 110.67 could see further declines to 109 – 109.5 region. However, on the 4-hour chart, there is a potential bullish flag taking shape, where an upside breakout above 111.31 – 111.50 could extend gains to 112.50 initially followed by a rally to the previous resistance level at 114.7 – 114.35. The bullish bias could be invalidated if USDJPY drops below 110.67 in which case we can expect a test of previous support at 109.
GBPUSD Daily Analysis
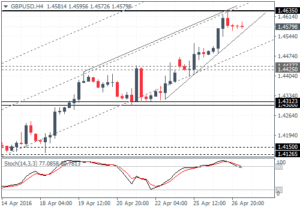
GBPUSD (1.45): GBPUSD continues to surge ahead with prices briefly trading near 1.4635 yesterday, having cleared the 1.4425 resistance, which could be tested for support in the near term. On the 4-hour chart, price action continues to trade within the evolving rising wedge pattern, a breakout of which could see a dip to 1.4312 – 1.43 on a break below 1.443 – 1.4425 higher support. Alternately, clearing the resistance above at 1.4635 could see further gains in store.
Gold Daily Analysis
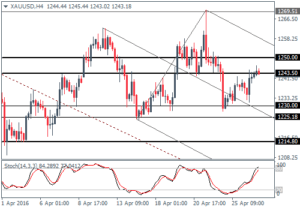
XAUUSD (1243): Gold prices are backing attempting to recover the lost ground with minor support at 1231 being established. Resistance is identified at 1250 – 1243 levels and with the hidden divergence currently on the 4-hour chart, Gold prices are likely to dip lower in the term ahead of further moves to the upside. Above 1250, gold could test the 1260 resistance which could see a potential start of a new bearish trend.
