EURUSD Daily Analysis
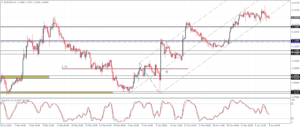
EURUSD (1.13): EURUSD remains trading sideways despite the market turmoil and the flight to safety, seen yesterday. The daily chart for EURUSD shows no conclusive evidence for the moment, clearly showing that the momentum is flat at the moment. Resistance at 1.147 remains in place and is pending a test of this level, while support at 1.13 comes to the downside. The 4-hour chart shows EURUSD currently trading near the lower median line with the past couple of sessions trading within a doji inside the bar. A breakout from this doji could see further bias being established, with a view that EURUSD could dip towards 1.13 in the near term.
USDJPY Daily Analysis
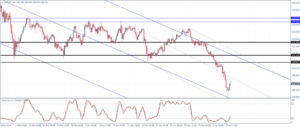
USDJPY (108.7): USDJPY closed yesterday at 108.21, and the daily chart is currently showing some bullish momentum, but still too early to tell. On the 4-hour chart, the newly plotted median line (dotted) shows USDJPY falling towards the lower median but the failure to find dynamic support off the lower median line indicates some upside potential. Broken support near 111.31 – 110.67 could be tested for resistance in the near term unless USDJPY resumes its bearish declines again. Stochastics do not offer any additional information at the moment so it is likely that USDJPY could either take a breather from the declines or resume its downtrend sooner or later.
GBPUSD Daily Analysis
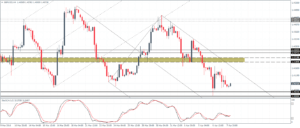
GBPUSD (1.40): GBPUSD was bearish yesterday, but trading was limited to the previous day’s range. The inside bar along with the Stochastics currently near the 20 level could see a short term move higher to 1.42. On the 4-hour chart, we see a bullish divergence on the Stochastics, which could see GBPUSD rally towards 1.422 – 1.42 level of new resistance for a test. The bias remains to the downside as long as this new resistance holds.
Gold Daily Analysis
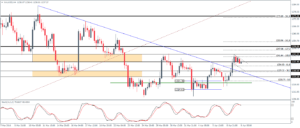
XAUUSD (1237): Gold pushed higher yesterday, and the current price action is showing a potential dip towards 1230 ahead of further gains. On the 4-hour chart, the current consolidation comes after a strong rally from the previous sessions. If the bullish flag pattern is formed here, Gold could test the levels of 1252 on a break above 1241 top that is formed currently. To the downside 1230 will be key to watch as a break below this level could see Gold post a strong correction to the downside.
