EURUSD Daily Analysis
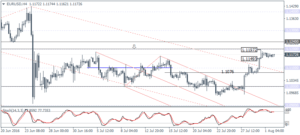
EURUSD (1.1172): The price action in EURUSD was quite limited yesterday, closing bearish, but still shy of confirmation to 1.120 resistance. The daily chart shows a hidden bearish divergence on the charts with resistance levels seen at 1.120 – 1.1240. Price action remains range bound within 1.1197 – 1.1149 levels pointing to a potential break out in either direction that could lead the way for further momentum led gains or declines. To the downside, support at 1.110 – 1.1076 remains a likely scenario.
USDJPY Daily Analysis
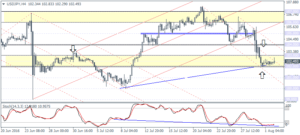
USDJPY (102.49): USDJPY has stalled in its declines with price seen bouncing off close to the 102 support level. A dip to 102 and a few pips lower cannot be ruled out, but the declines are limited as long as the support holds. On the 4-hour chart, with price action firmly within 103 – 102 support zone, we can anticipate further sideways price action. Only a close above 103 and a possible higher low will confirm early signals for a move to the upside. 104 resistance remains strong at the moment.
GBPUSD Daily Analysis
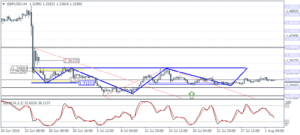
GBPUSD (1.319): GBPUSD formed an inside bar yesterday, and the ranging price action could extend into a second day with the price hovering near 1.32. On the 4-hour chart, the inverse head and shoulders pattern remains in play with the neckline resistance at 1.36 – 1.3488 likely to hold the gains in the near term. The bullish view that is evolving could be at risk if GBPUSD closes below 1.30, which will invalidate the bullish bias and pave the way for further declines to 1.280.
Gold Daily Analysis
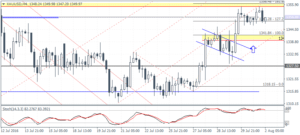
XAUUSD (1349.97): Gold prices rallied back but closed modestly higher just a few points above 1350. A bearish close today and below yesterday’s low of 1346.40 would confirm a move to the downside with support seen at 1300. To the upside, price action may hover near the current levels with a more firm test to 1355 – 1356 region to mark the completion of the measured move from the bullish flag pattern. A break below the current support established at 1350 – 1348.28 will, however, see the weakness in price send gold down to the lower support at 1341.85 – 1339.45.
