EURUSD Daily Analysis
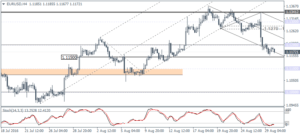
EURUSD (1.1172): EURUSD closed with a doji candlestick pattern yesterday, and its significance increases as the indecision comes after a few sessions of strong declines. On the 1-hour chart, we see a strong case for a bullish divergence with the Stochastics printing a higher low against the current lower low in price. This indicates a near-term correction towards 1.1270 – 1.1281 resistance level that needs to be validated to support the basis for further declines. To the downside 1.1150 remains the target in sight. Watch for a possible upside breakout above 1.1200 resistance for the correction to be triggered, while to the downside 1.1150 could see the downside target being reached while at the same time offering a potential support level for prices.
USDJPY Daily Analysis
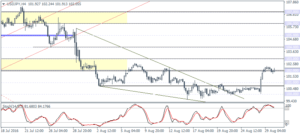
USDJPY (102.05): USDJPY moved in a very small range yesterday following the strong bullish candlestick from Friday. Prices are seen struggling near 102.00 resistance level indicative of a near term correction. The 1-hour chart on USDJPY is flashing a bearish divergence above 102.00 and points to a dip in USDJPY towards 101.00 – 100.80 support level that could be tested. As the bias remains to the upside, a retest of this support level could signal further upside towards 104.00.
GBPUSD Daily Analysis
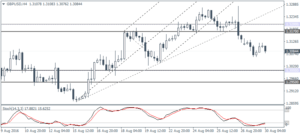
GBPUSD (1.3084): GBPUSD closed in a doji pattern yesterday with price seen caught within 1.3200 and 1.3000 levels. The price action on the 1-hour chart is similar to that of EURUSD which signals a near-term correction towards 1.3170 – 1.3200. A retest of this broken support level for resistance could see GBPUSD renew its momentum for further downside as 1.3000 support remains a very likely target that could be tested.
Gold Daily Analysis
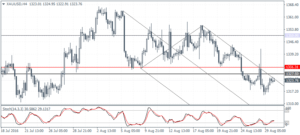
XAUUSD (1317.95): Gold prices closed positive yesterday, but the price action was very muted. With the resistance zone established near 1331.30 – 1327.50, we could expect gold prices to retest this resistance level. However, there is scope for prices to breakout higher above this resistance in which case; gold prices could be seen aiming for the $1350.00 handle once again.
