EURUSD Daily Analysis
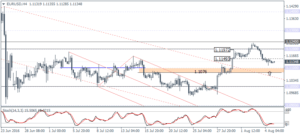
EURUSD (1.1134): EURUSD closed at 1.1128 yesterday, just above the 1.110 support level. We expect the 1.110 support to be tested, and the downside will be limited until this level breaks convincingly. On the 4-hour chart following the fake upside breakout above 1.11972, EURUSD eventually closed below 1.11493 with the bias open for a test to 1.110 – 1.1076 support zone. Further declines can be expected below this support zone, in which case, 1.10 remains open for a retest of support.
USDJPY Daily Analysis
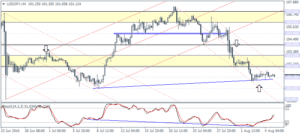
USDJPY (101.12): USDJPY closed with a doji candlestick pattern yesterday which could either signal a near term correction to the upside or a continuation. The 100.00 psychological price level will be an important support to the downside, while 102 needs to give way as resistance in order for the dollar to extend gains towards 104. On the 4-hour chart following the fresh lows that were posted near 100.684, USDJPY bounced higher. A higher low near 101 could, however, signal an early change of the short-term trend. Still, watch for 102.00 which remain as a strong resistance.
GBPUSD Daily Analysis
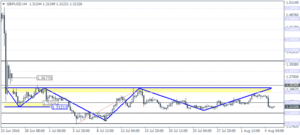
GBPUSD (1.313): GBPUSD broke down below 1.32 yesterday with prices showing a minor recovery in early Asian trading today. But a daily bullish close will be required for confirmation. In the meantime, GBPUSD is forming a symmetrical triangle pattern near the current lows which indicates that price could either break down below 1.30 for a continuation of the downtrend, or an upside breakout above 1.34 which will see price correct towards 1.36 and 1.38 eventually. On the 4-hour chart, although the inverse head and shoulder is still in play, the pattern is looking increasingly weaker. A close below 1.30 will invalidate any bullish bias.
Gold Daily Analysis
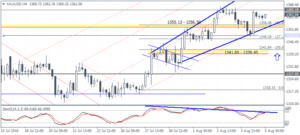
XAUUSD (1362.56): Gold prices recovered following Wednesday’s declines, but price remains within the inside bar’s range of 1367.32 and 1347.20. Breakout from the inside bar range will likely signal the near term bias in prices. Main support is seen at 1315 – 1300 while to the upside; support at 1360 will need to be established ahead of posting further gains. On the 4-hour chart, gold’s price action is showing a broadening wedge pattern with a retest to 1365 pending. A reversal near 1365 could potentially send gold prices lower following the breakout of the trend line. Watch for 1348 – 1350 support followed by 1341 – 1340 support to the downside.
