EURUSD Daily Analysis

EURUSD (1.108): The price action in EURUSD was quite limited with price testing 1.110 briefly. The bias in EURUSD remains to the downside with the likelihood of a test towards 1.10 support. On the 4-hour chart, EURUSD has remained flat, trading within the minor support/resistance zone of 1.110 – 1.1076. As long as prices remain capped near this level, the downside to 1.10 is quite likely.
USDJPY Daily Analysis
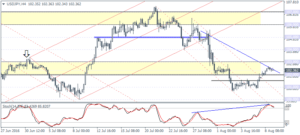
USDJPY (102.36): USDJPY has managed to close above 102 yesterday, and the upside is likely to prevail for a move to 104. On the 4-hour chart, USDJPY has formed a hidden bearish divergence, and the downside is likely to see a retest to 102 – 101.55. A break down below 101.55 could potentially see USDJPY turn bearish with a test back to previous lows of 101, while to the upside, establishing support near 101.55 – 102 could see USDJPY push higher towards 104 and eventually to 105.
GBPUSD Daily Analysis
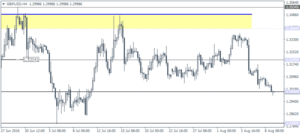
GBPUSD (1.299): GBPUSD has broken out from the symmetrical triangle and prices were seen testing 1.30 support following the breakdown of prices from the inside bar that was formed on Monday. Price action on the 4-hour chart is trading within 1.32 – 1.30 price zone. To the downside, GBPUSD could potentially test 1.28 although price action is likely to remain trading flat within 1.30 – 1.32 for the near term.
Gold Daily Analysis
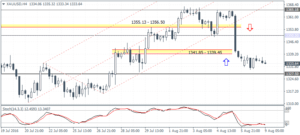
XAUUSD (1333.64): Gold was seen trading flat yesterday with price action staying fairly limited. Price is seen consolidation within 1340 – 1330 levels opening up the possibility for gold to test support near 1327.50. Resistance, to the upside, is now seen at 1341 – 1340 and further upside, back towards 1350 can be expected only on a strong break out above the immediate resistance level. In the near term, gold prices are likely to remain range bound within 1340 – 1327.50 levels.
