EURUSD Daily Analysis
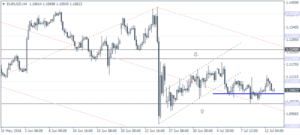
EURUSD (1.106): EURUSD failed to close back above 1.110 resistance yesterday with price action continuing to trade flat within 1.11 and 1.10 price levels. The daily chart’s price action shows a bearish flag being formed and could see a potential continuation to the downside on a break out below 1.10. On the 4-hour chart, the previously mentioned bear flag continues to be valid with price retesting the 1.110 level. The further downside could be therefore expected on a price breakout below 1.10.
USDJPY Daily Analysis
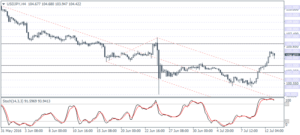
USDJPY (104.42): USDJPY rallied yesterday to close above 104 as noted. The daily chart is seen with prices consolidating within a descending wedge pattern with the potential to test the previous resistance at 106, last seen around June 23. In the near term, USDJPY could remain range bound between 106 and 102 levels. On the 4-hour chart, the hidden bearish divergence confirms the view for a potential correction to 102 – 101.5 support level.
GBPUSD Daily Analysis
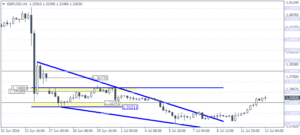
GBPUSD (1.330): GBPUSD closed above 1.320 resistance yesterday and any dips could be supported above this level now. Establishing a base at 1.32 could see GBPUSD extend its gains towards 1.34 which marks a retest of the resistance level between 1.34 and 1.3420. The falling wedge shows a continuation to the upside with the main target at 1.3677 – 1.380. Extending the gains here could be seen as filling the gap as well as an establishing resistance at this level which could confirm renewed downside in the medium term.
Gold Daily Analysis
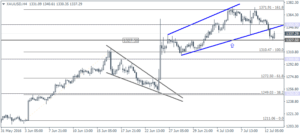
XAUUSD (1337.29): Gold prices broke below 1350 yesterday and could continue the declines albeit a brief retest back to 1350 to establish resistance. The upside remains capped for the moment until support level is established. 1300 remains a critical price level in this aspect and could keep prices supported in the near term. On the 4-hour chart, gold is seen bouncing off just a few points above the 1327.50 support level noted yesterday.
