EURUSD Daily Analysis
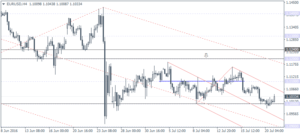
EURUSD (1.103): EURUSD briefly tested 1.10 support yesterday before managing to close above the support. The currently bullish price action today could see near term upside if prices close on a bullish note. This is validated by the bullish divergence seen on the daily chart and points to a correction to 1.120. Of course, a daily close below 1.10 support could invalidate the above view with EURUSD likely to test the next support at 1.09. On the 4-hour chart, the price action is clearer with price bouncing off 1.10 support. Watch for the intermediary resistance at 1.110 ahead of a move to 1.120.
USDJPY Daily Analysis
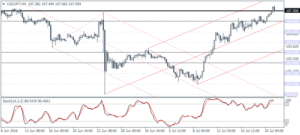
USDJPY (107.09): USDJPY broke above 106 resistance yesterday with the rally picking up steam on news wires reporting that the BoJ could add another 20 trillion yen to its stimulus package when it meets later in July. Support is seen at 104.5 – 104.0 and could potentially keep price from pushing lower. On the 4-hour chart, USDJPY is seen trading near 107 resistance, but further upside can be expected only on a retest of 107 for support, which leaves USDJPY vulnerable for a correction. Below 104 – 104.50 support next, main support levels are seen at 103 – 102.
GBPUSD Daily Analysis
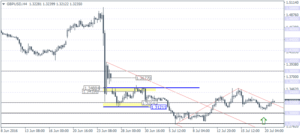
GBPUSD (1.323): GBPUSD has managed to bounce back after testing lows of 1.306 yesterday. Price action shows a modest inverse head and shoulders pattern at the current level with the minor neckline resistance seen at 1.34. A bullish close above 1.34 could signal a near term rally towards 1.38, which will eventually fill the June 24 unfilled gap as well. To the downside, price action seems well supported near 1.32 – 1.30 support zone.
Gold Daily Analysis
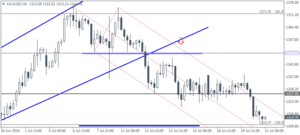
XAUUSD (1314.76): Gold prices continued to slide yesterday with price action closing below the inside bar’s low of 1320.31 formed last Thursday. Support at 1300 remains the next key level of importance. On the 4-hour chart, the dip to 1300 – 1310.50 marks the completion of the breakout from broadening wedge. To the upside, resistance at 1327.50 remains vital and a break out above 1327.50 could see gold prices extend their gains towards 1350.
