EURUSD Daily Analysis
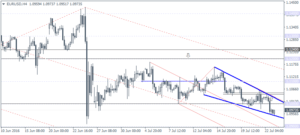
EURUSD (1.097): With EURUSD closing below 1.10 on Friday, price action is now looking bearish with the potential to slide towards 1.09. On the 4-hour chart, EURUSD is seen trading within the falling wedge pattern, and a close above 1.10 could see a near term retracement to 1.105 – 1.104 minor resistance. Watch for a possible break out from the median line in which case; price could be eyeing a deeper retracement potentially to 1.110. To the downside, if resistance is established at 1.10, we could expect to see EURUSD fall towards the next main support at 1.09.
USDJPY Daily Analysis
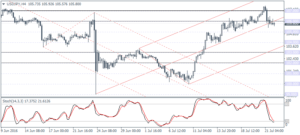
USDJPY (105.80): USDJPY has formed an inside bar on Friday. Price action is likely to be limited to the FOMC meeting first, trading within 107 – 106 price levels in the near term. A bearish close below 106 is required for USDJPY to post a correction. Support at 103 – 102 will be key in this aspect. To the upside, a close above 107 could see renewed bullish bets emerge, in which case, 110 remains the initial price level in sight.
GBPUSD Daily Analysis
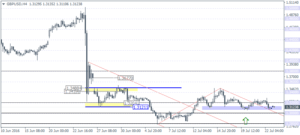
GBPUSD (1.312): GBPUSD closed bearish on Friday and below 1.320. Still, price action could move in either direction. A close back above 1.32 could keep the bullish bias intact while to the downside, 1.30 remains the next main support level of interest. On the 4-hour chart, price action fell to the minor head and shoulders support level at 1.311 – 1.308. A breakdown below this minor support could see GBPUSD slide towards 1.30 – 1.285 support. The bearish bias is likely to fail if GBPUSD can close above 1.32 on a daily session.
Gold Daily Analysis
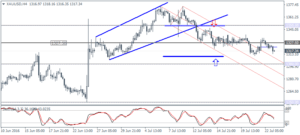
XAUUSD (1317.34): Gold prices continue to post gradual declines with the current bearish price action retracing the gains from last Thursday. Still, the bullish flat pattern on the daily chart remains key with 1350 resistance likely to be tested and could limit the rally. On the 4-hour chart, gold prices are currently posting a higher low and a bullish close above 1327.50 could validate the correction towards 1350. Also, watch for a potential bullish divergence being formed currently.
