EURUSD Daily Analysis
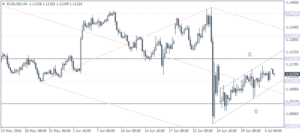
EURUSD (1.113): EURUSD is seen pulling back after edging higher yesterday. Having cleared 1.110, the current pullback could be limited to 1.110 to establish support. In such an event, EURUSD could potentially be forming a base at 1.110 for the eventual test to 1.120 resistance. On the 4-hour chart, price action has been strongly consolidating over the past week, moving within a rising price channel and forming a subsequent bull flag pattern, which raises the risk of a breakdown of prices below 1.110. In this case, a bearish reversal near 1.110 could potentially signal an eventual decline down to 1.10.
USDJPY Daily Analysis
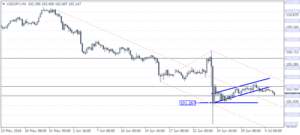
USDJPY (102.1): USDJPY has been giving up its gains from the past week with prices seen testing the 102 support. A break below 102 could potentially trigger further declines with prices likely to fall back to 101.267, from June 24th close. Support is seen at 101.267 – 101.0 levels to the downside which could hold the prices. USDJPY is also forming a bearish flag pattern but could be validated only on a strong close below the lower support levels.
GBPUSD Daily Analysis
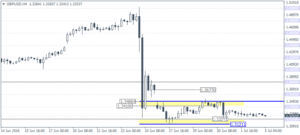
GBPUSD (1.325): GBPUSD has been pushing lower although price remains range bound within 1.34 and 1.32. The 4-hour chart also shows the strong sideways price movement within 1.3488 and 1.320 levels. The Stochastics oscillator is, however, pointing to a bullish divergence at the current lows which increases the likelihood of a breakout to the upside. A close above 1.3488 could signal further upside towards 1.3677 and to 1.380 eventually.
Gold Daily Analysis
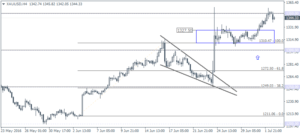
XAUUSD (1344.33): Gold prices closed at 1350 yesterday, and the current consolidation could remain in play for the near term. On the 4-hour chart, price action is seeing a bearish reversal with the doji candlestick formed a few sessions ago followed by the bearish close. Declines could be limited to 1327.50 to retest the sideways’ price action resistance level to establish support.
