EURUSD Daily Analysis
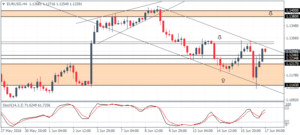
EURUSD (1.125): EURUSD briefly attempted to break out below 1.120 support but closed the day above the support level, making it increasingly possible for EURUSD to remain range bound within 1.130 and 1.120 resistance and support levels. Ahead of 1.130 resistance, the minor resistance at 1.293 – 1.2860 has been containing price rallies so far. A break above this minor resistance could see EURUSD rally towards 1.130 and potentially extend gains to 1.1380 – 1.140 major resistance.
USDJPY Daily Analysis
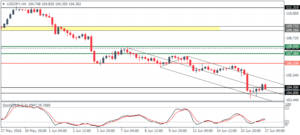
USDJPY (104.3): USDJPY fell to new lows yesterday, briefly dipping below 104.0, but prices have since then pulled back to close the day at 104.26. To the upside, USDJPY needs to clear above 105.6 – 106.27 minor resistance to validate any upside bias, while to the downside, USDJPY could remain range bound trading above the 104.0 handle. A break below 104 could extend declines further but could remain choppy. So far, the support at 104.50 – 104.0 has managed to hold and could contain prices near this level in the near term.
GBPUSD Daily Analysis
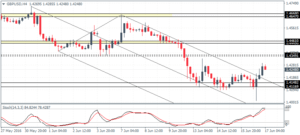
GBPUSD (1.428): GBPUSD closed with a doji pattern yesterday after falling below 1.4053 briefly. Failure to close below 1.4114 indicates the price level acting as a strong support within 1.4114 – 1.4053. To the upside, resistance at 1.4425 remains key, and a break above this resistance could extend further gains. On the 4-hour chart, GBPUSD could potentially point to a move to 1.435 – 1.436 minor resistance level if the current pullback stalls at the previous support near 1.4148 – 1.41170 levels.
Gold Daily Analysis
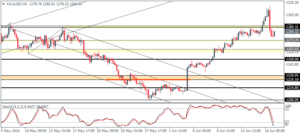
XAUUSD (1284): Gold prices declines sharply yesterday after testing new 2016 highs of 1315. The daily chart head and shoulders pattern remains in play, but the further downside is required to validate the move to 1230 – 1225 initial support. On the 4-hour chart, prices are back below the 1290 – 1291 resistance level which could be tested yet again. Establishing resistance here could signal further downside, initially to 1273 – 1270 followed by 1262 – 1260 support. Alternately, a close above 1290 – 1291 could signal a potential move to the upside with the likelihood that $1300 act as a new floor for gold prices.
